Keep your finger on the pulse of the app with a new customizable Project Overview Dashboard
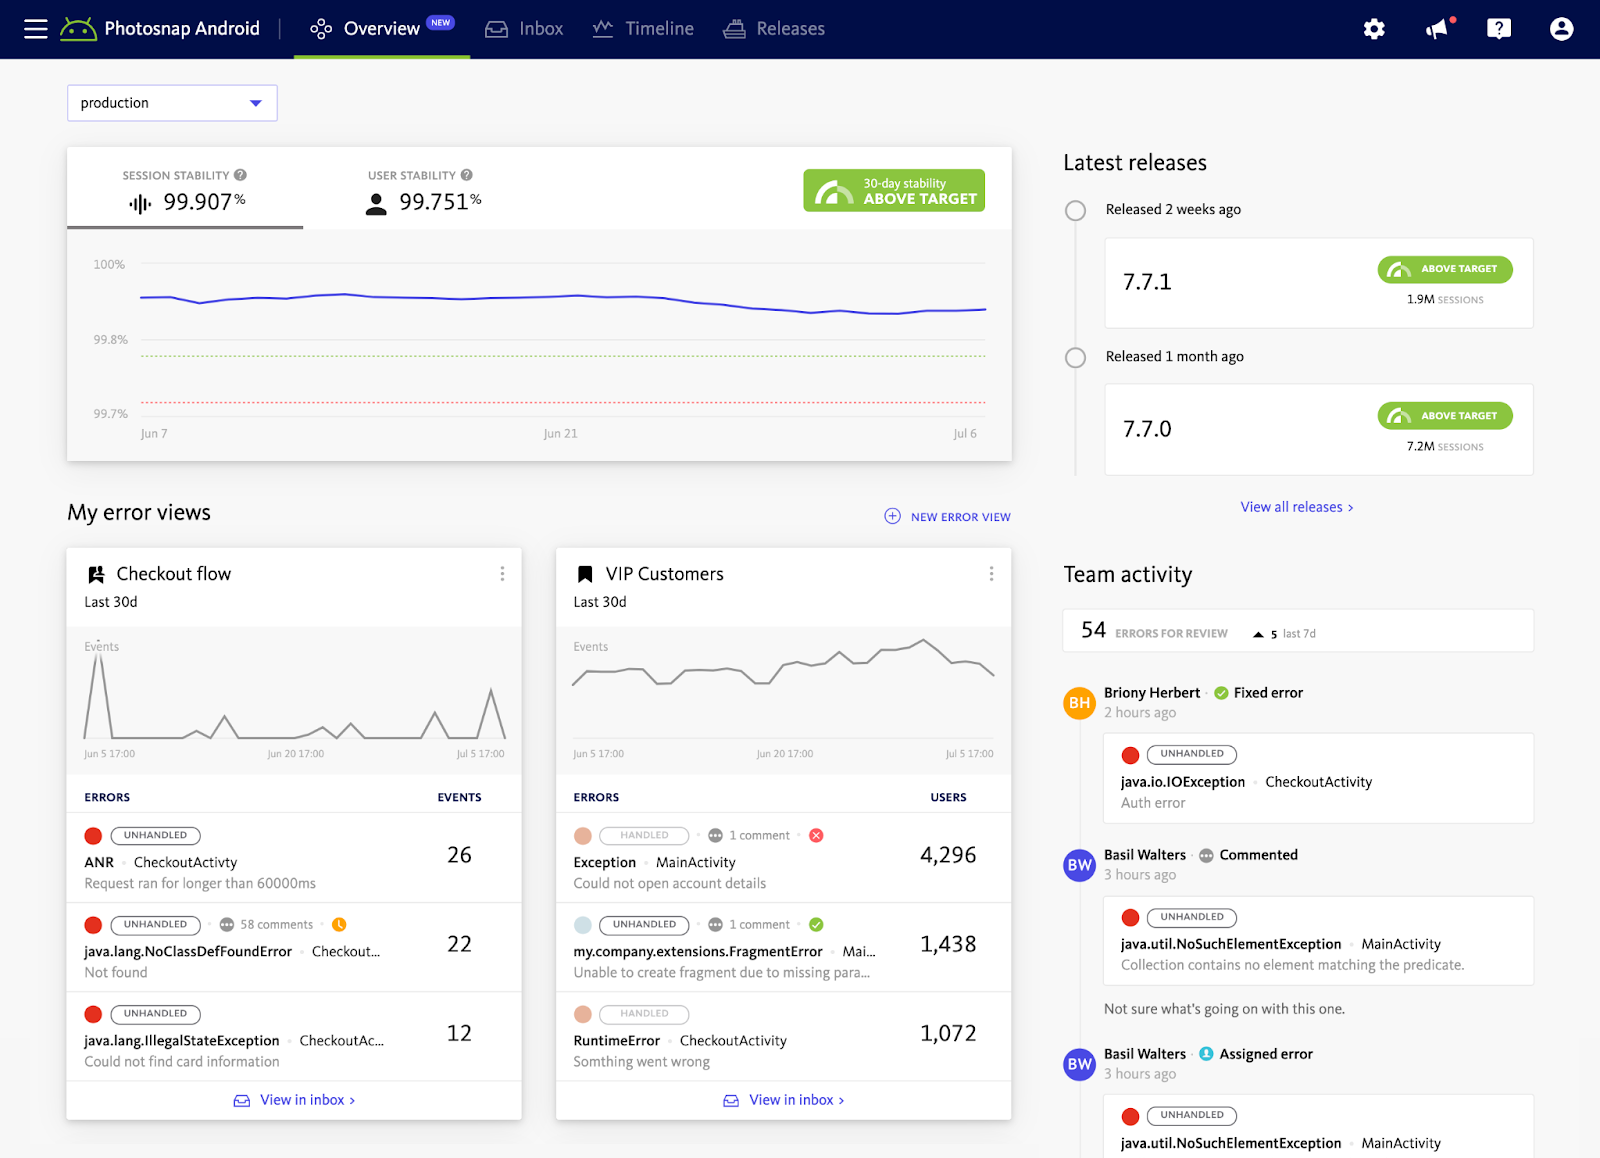
We’re excited to introduce the Project Overview Dashboard, a brand new view that provides key insights into a project or app you’re monitoring in Bugsnag.
Last year, we introduced the Stability Center to provide an overall stability score for each app, coupled with insights into how app stability has changed over time. The Stability Center displays the stability of all your apps in one central location. The Project Overview Dashboard will serve as the new hub for analytics and insights of a single app.

Let’s dive deeper into the visibility you will have in the new dashboard and how you can customize it to keep your finger on the pulse of the app.
Analytics and insights into app stability and quality of the user experience
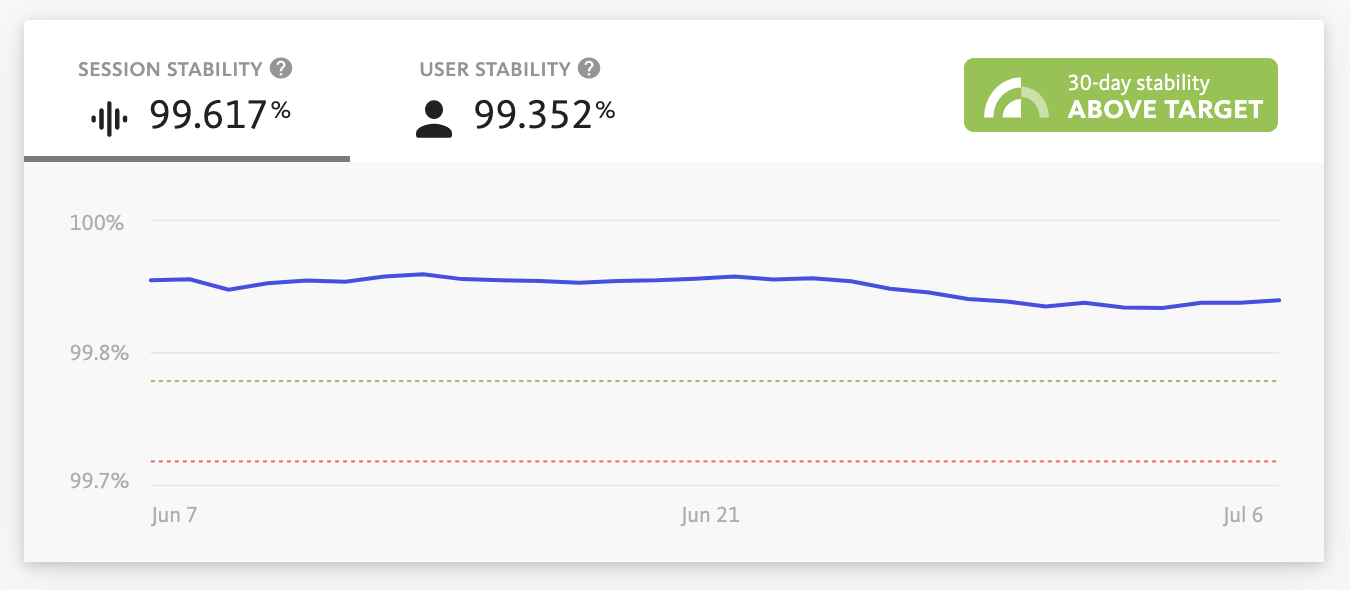
The Project Overview Dashboard provides the 30-day user and session stability scores with indicators to show if the app’s stability is above target stability, below target stability, or below critical stability. There are also stability trends graphs for each type of stability score with target stability and critical stability markers (shown for the type of stability measure chosen for stability targets) as well as a stability snapshot of the latest releases.

These stability analytics help you to understand the current stability of the app and how it has changed over the last 30 days. You can also see how app stability is trending against targets and identify any issues that need to be addressed, such as when app stability drops below critical stability. Stability scores and targets can help drive data-driven decisions about when development teams need to be focused on building features vs. fixing bugs.
Soon, you will also be able to understand the stability of the app and how it’s trending against targets in the daily and weekly summary emails from Bugsnag. This will allow you to be aware of the app’s stability without having to check Bugsnag. Should an email alert you of a stability issue in the app, you can click through to gain further insights and take action.
Gain visibility into errors impacting important segments with customizable error views
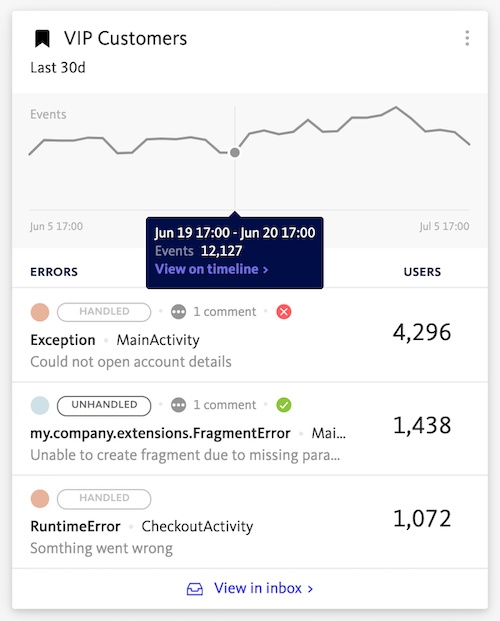
We’re excited to share that this dashboard can be customized to provide deeper insights into error segments that matter to you. Using bookmarks, which are a set of saved error filters in Bugsnag, error views can be configured for each team member working on building and maintaining the app. An error view includes a feed of errors and a trend graph to show how errors are impacting the stability of the segment.

Error views allow you to keep an eye on errors impacting segments or cohorts that matter to you, such as those affecting VIP customers, originating from your part of the codebase, or impacting critical app functions like the checkout or new user sign up flows, for example. Since not all bugs are worth fixing, it’s useful to see the ones that do need your attention highlighted so that you can prioritize and fix them quickly to improve app stability and user experience.
See the team’s progress in triaging and fixing errors with a team activity feed
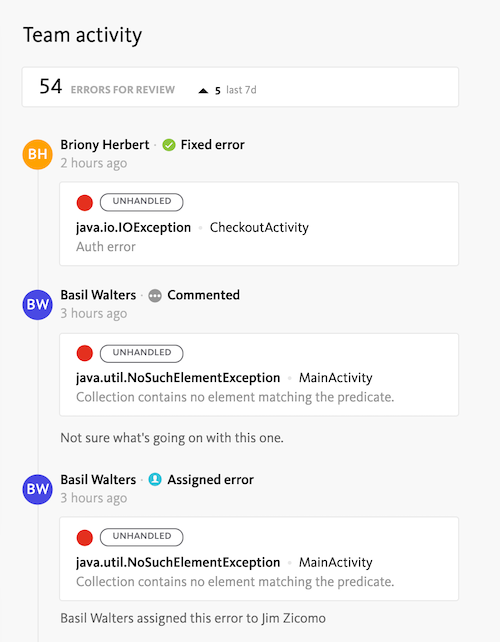
In addition to the insights into the stability of the app and visibility into errors impacting important segments, you can also use the new Project Overview Dashboard to see the team’s progress in addressing stability issues in the app. The team activity feed provides an overview of error status changes, comments, linking of errors to issues, and more.

The team activity feed allows you to stay aware of which errors are being triaged and fixed and how they are progressing through the debugging workflow, which can increase team alignment around addressing stability issues. Engineering Managers may also use the team activity feed to monitor and understand the team’s overall activity around fixing bugs.
How to get started
The new Project Overview Dashboard is available now for mobile, web, and backend apps for customers on all Bugsnag plans.
- Stability analytics and insights in the dashboard are available on the Standard and Enterprise plans.
- Customizable error views are available on the Enterprise plan.
We’re excited for you to customize and use the new dashboard on a daily basis to keep your finger on the pulse of your app. Please don’t hesitate to contact Support if you have any questions or feedback.
If you’re new to Bugsnag, start a 14 day free trial or request a demo to see this and other capabilities of our stability management platform in action.