
BugSnag Beginners Series – Error Details
Hello, and welcome to part two of the BugSnag Beginners Series! We will cover the error details page and how it can be used to maximize error debugging in your BugSnag Dashboard. We’ll start by going over how error details heading information is organized, followed by what different pivots mean, how the status box works, where to find diagnostic data, and lastly how to create custom filters using your error’s metadata. Let’s start by clicking into an error from the Error Inbox, bringing us to the error details page.
Error Details Heading
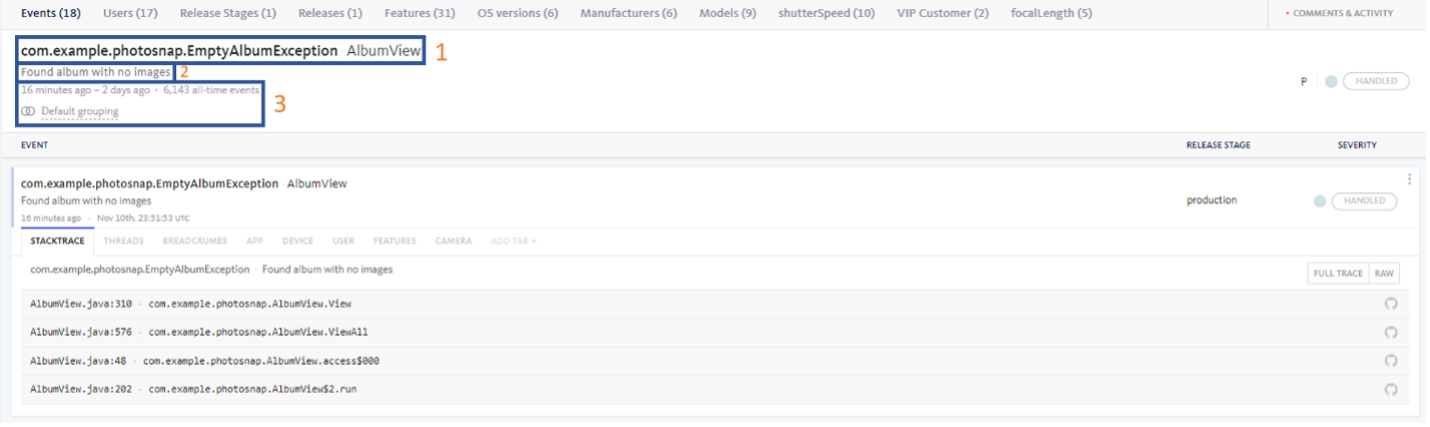
An error’s heading information is a great place to start the debugging process. At the top of the heading is the error class, which will appear alongside the blame frame pulled from the error’s stack trace. On the line below is the error message that was given by the exception when it occurred. The bottom two lines display general information about the severity and frequency of the error, as well as the grouping logic that was applied to that particular class of errors.
Note: Error details data will vary by platform.
Pivots
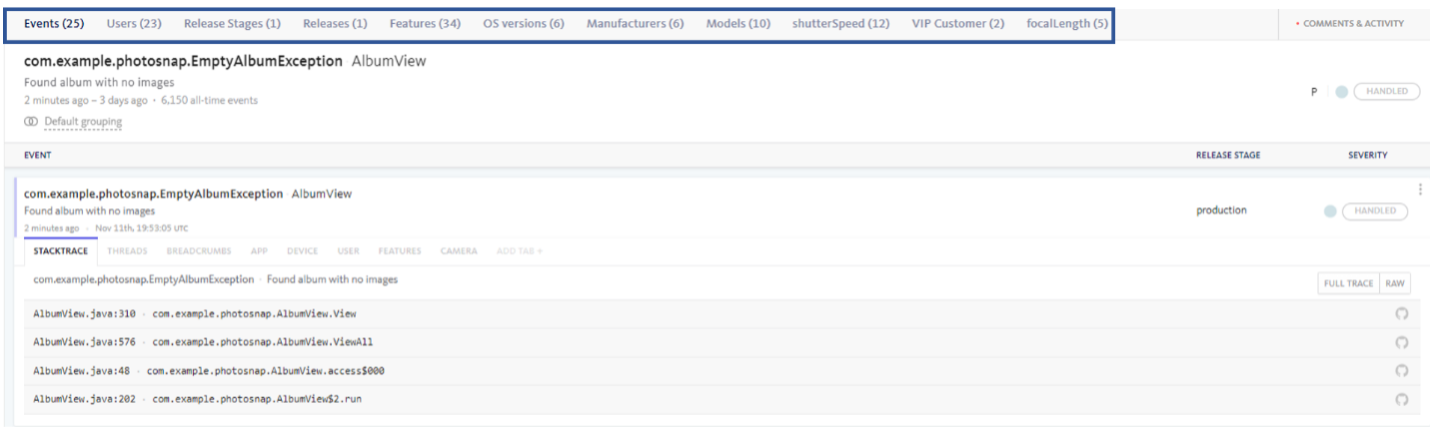
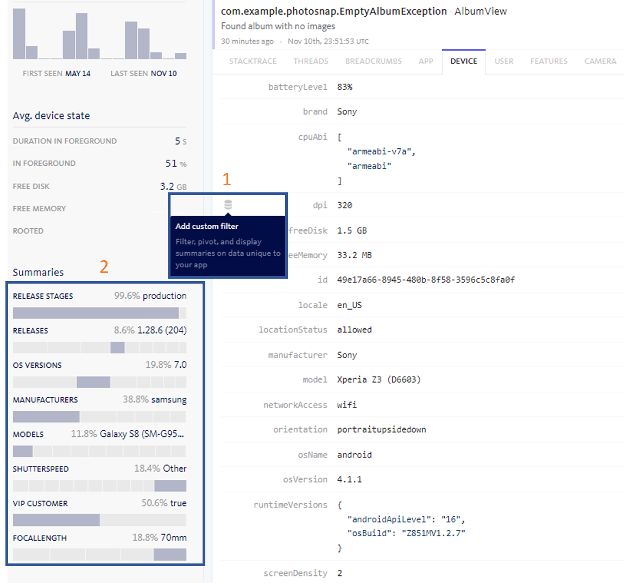
Transitioning to the next topic, let’s discuss the different list views available within a group of errors, which are known as pivots. By default, the error details page displays a class of error events based on how recently they occurred within the app; however, by selecting different pivots at the top of the page, a variety of segmented errors can be explored. Aside from the aforementioned event pivot, the segmented list views are as follows:users impacted, release stages the error was seen in, which release version the errors occurred in, features flagged within the error, and device details such as OS and model. Custom pivots also can be created for further segmentation, such as shutter speed, focal length, or VIP customers impacted, as seen below in our camera app.
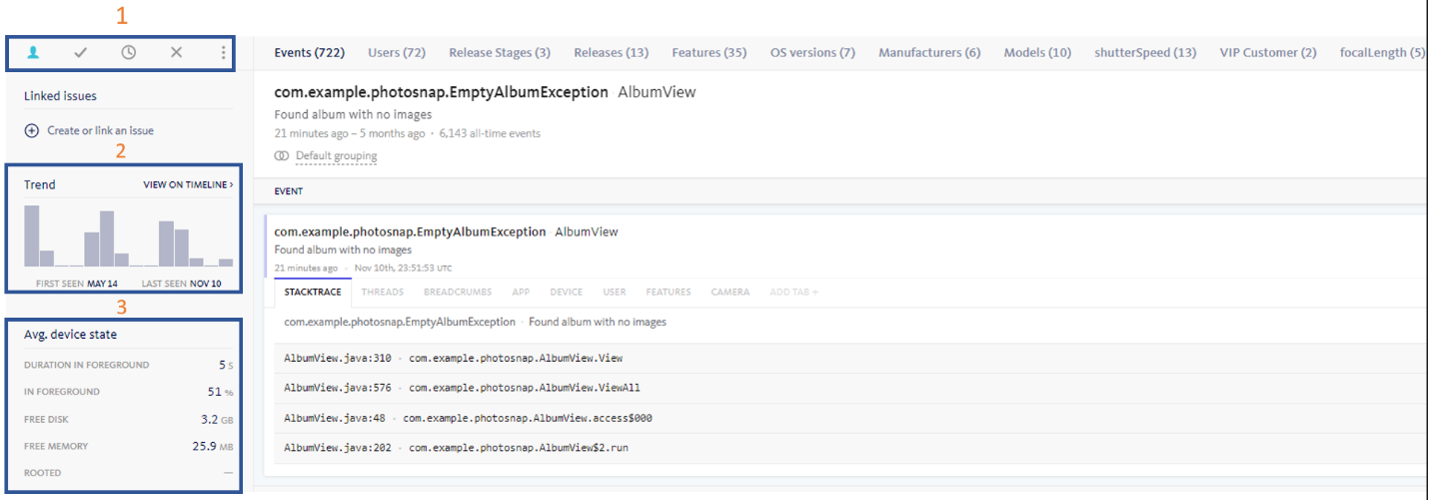
Status Box
The status box seen on the lefthand side of the error details page contains three useful sections. The first at the very top is specifically designed for quick triage by assigning various errors a workflow status. For more on workflow statuses, check out Part One of the BugSnag Beginner Series. The next section in the status box is the histogram of the error class, labeled as the Trend. This displays the app health in relation to that error class within the currently selected time period, displaying up to 60 days of historical data. The final section in the status box is the average device state. Here, device-specific information –such as foreground duration, memory states, and whether the device was jailbroken – can be found.
Note: Average device state will only appear for mobile app projects.
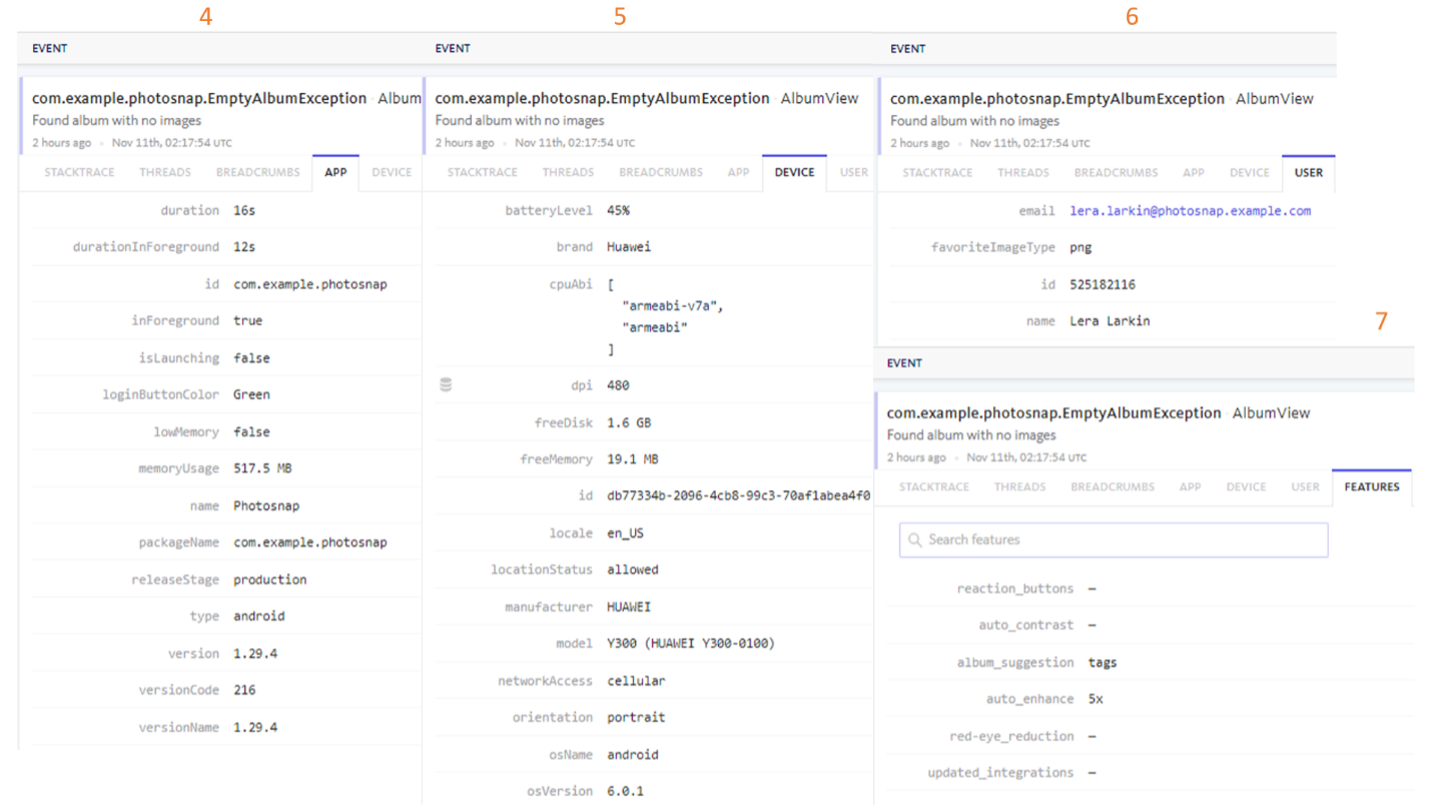
Diagnostic Data
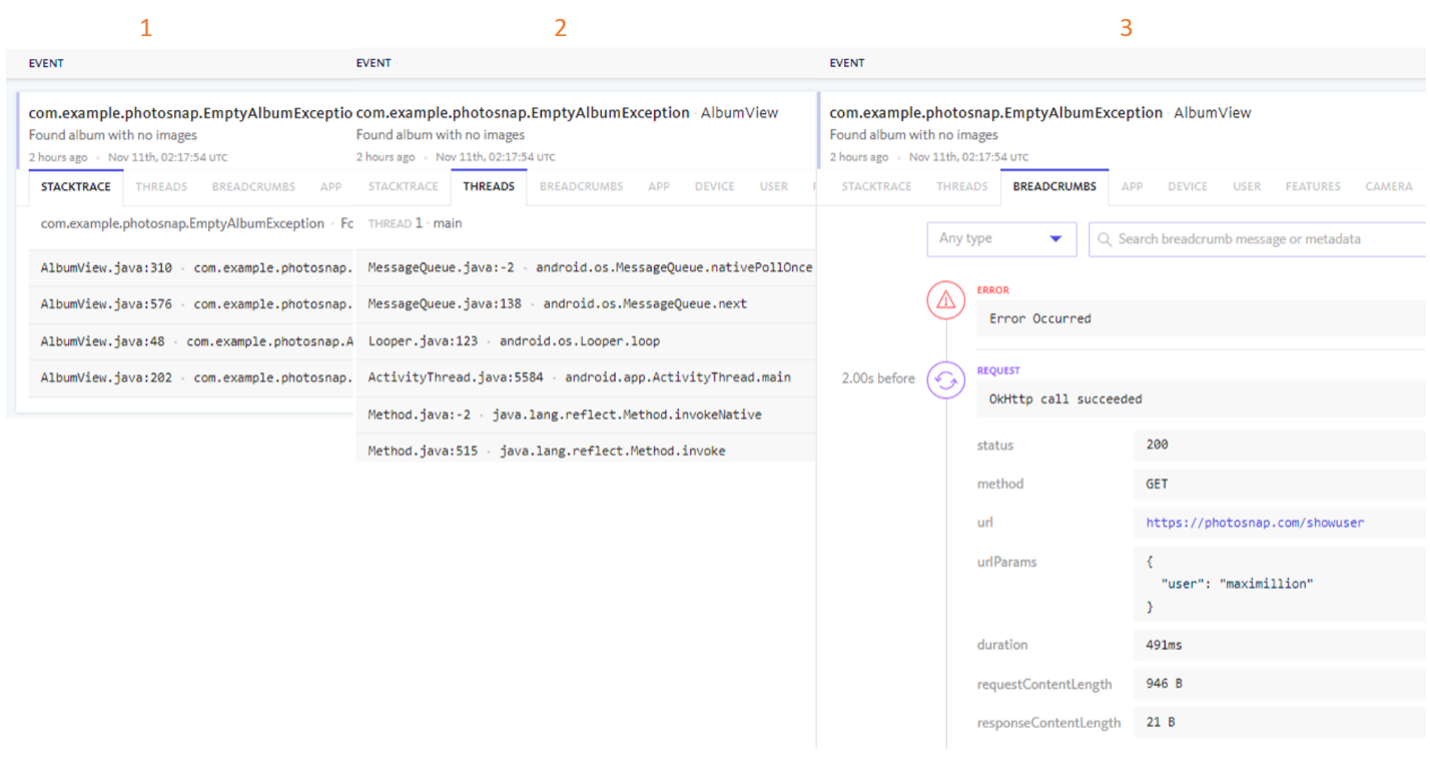
By clicking into the error, diagnostic data will be displayed to help better understand what steps the user took before the error occurred. The first key diagnostic that appears is the full stack trace, as well as an option to view the raw data and the threads. Next to the stack trace are the breadcrumbs, where the user clicks and screen views can be seen. Going further right, app and device state is displayed to provide device specific information that may have caused the error. Lastly, user and feature flags can be seen if previously configured, which add an extra level of granularity to the debugging process.
Custom Filters
From the diagnostic data display, custom filters can be created by clicking the index button found to the left of any of the metadata. Custom filters will be displayed under the Summaries box found to the bottom left of the page, and as queryable custom attributes within the Error Inbox. By default,10 custom filters can exist within a Dashboard – so create with care. If a custom filter was added by mistake, it can be deleted from Project Settings by clicking Custom Filters.
We look forward to seeing you In part three of this series, where we’ll cover the Releases page and the Stability Center.