
How BugSnag uses BugSnag to detect user frustration
Frustration Detection: Monitoring usability issues with Bugsnag
As engineers at Bugsnag, we constantly use Bugsnag (the product) to monitor Bugsnag (the applications). Since we use the product so often, it’s easy to start to believe that we understand how customers experience our dashboard. But in reality, our customers have a much wider range of experiences in the app than we do. They may be an employee of a massive company that has a much larger data set to display. They may be using a different browser or device. Or they may be new to Bugsnag or to SaaS monitoring tools altogether and feel disoriented or confused when they’re getting started.
While we collect web analytics and application metrics that can help us understand the scale of performance or usability issues with the site, there are particular kinds of events we like to track with Bugsnag so we can have a richer view of how customers experience the site. Here are some of the techniques we can use to do that:
Slow page load tracking
This approach came out of a request from James, our CEO. We have a handful of customers who are outliers in either amount of data sent to Bugsnag or number of users in their organization, and they’re often the first to see performance issues if something in our system is slow. He wanted to know where he could see a list of organizations that have been affected by performance issues on the site. While we have good visibility into slow requests in our infrastructure monitoring, it’s a challenge to break these out by organization, and the data lives in tools that many employees don’t access regularly.
To make this information more accessible, we decided to start tracking it in a place we naturally look all the time: Bugsnag. We wrote a small piece of client-side javascript to report a custom error to Bugsnag every time a slow request happens:
// Set slow request threshold to 10 seconds (10,000ms)
const SLOW_REQUEST_THRESHOLD_MS = 10000;function trackPageLoadTime() {
// Skip browsers that don’t support navigation timing
if (!window.performance || !window.performance.timing) { return; }const requestStart = window.performance.timing.requestStart;
const requestEnd = window.performance.timing.domComplete;
const loadTime = requestEnd – requestStart;// If the page isn’t done loading, try again later
if (!requestEnd) {
return setTimeout(trackPageLoadTime, 1000);
}// Notify Bugsnag if page load time has exceeded the threshhold
if (loadTime > SLOW_REQUEST_THRESHOLD_MS) {
Bugsnag.notify(‘Slow page load’, `Load time exceeded ${SLOW_REQUEST_THRESHOLD_MS}s`, {
request: { ‘page load time’: loadTime },
// Merge organization information into the user metadata tab:
user: { organization: organizationSlug },
});
}
}// Don’t start checking until the page is likely to have loaded
setTimeout(trackPageLoadTime, 3000);
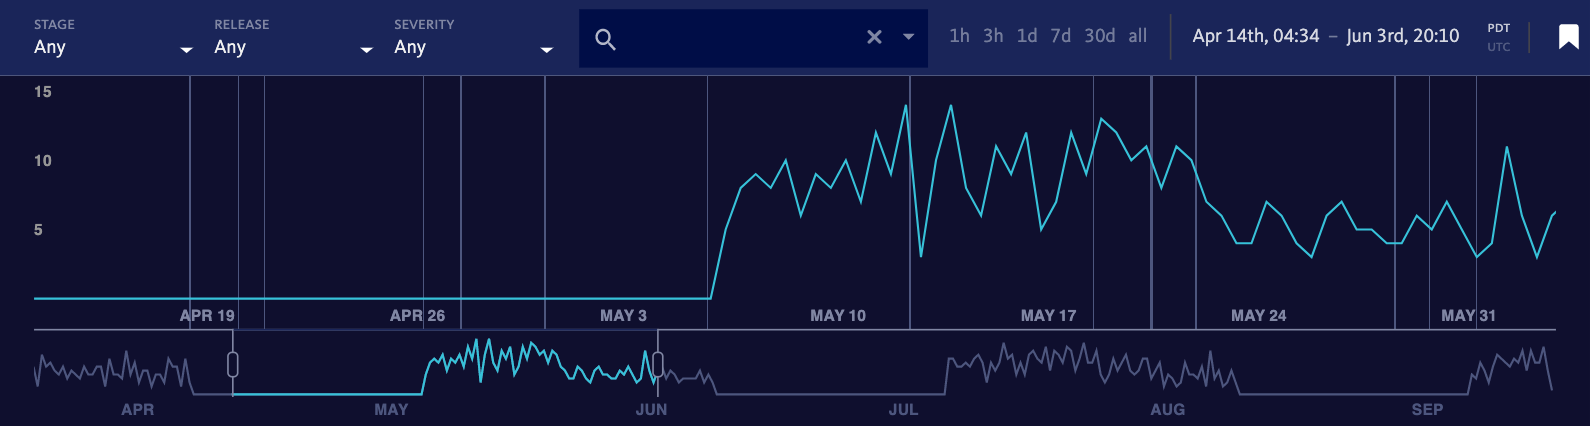
By itself, that is enough to give us both a graph of all slow requests and a list of users affected:
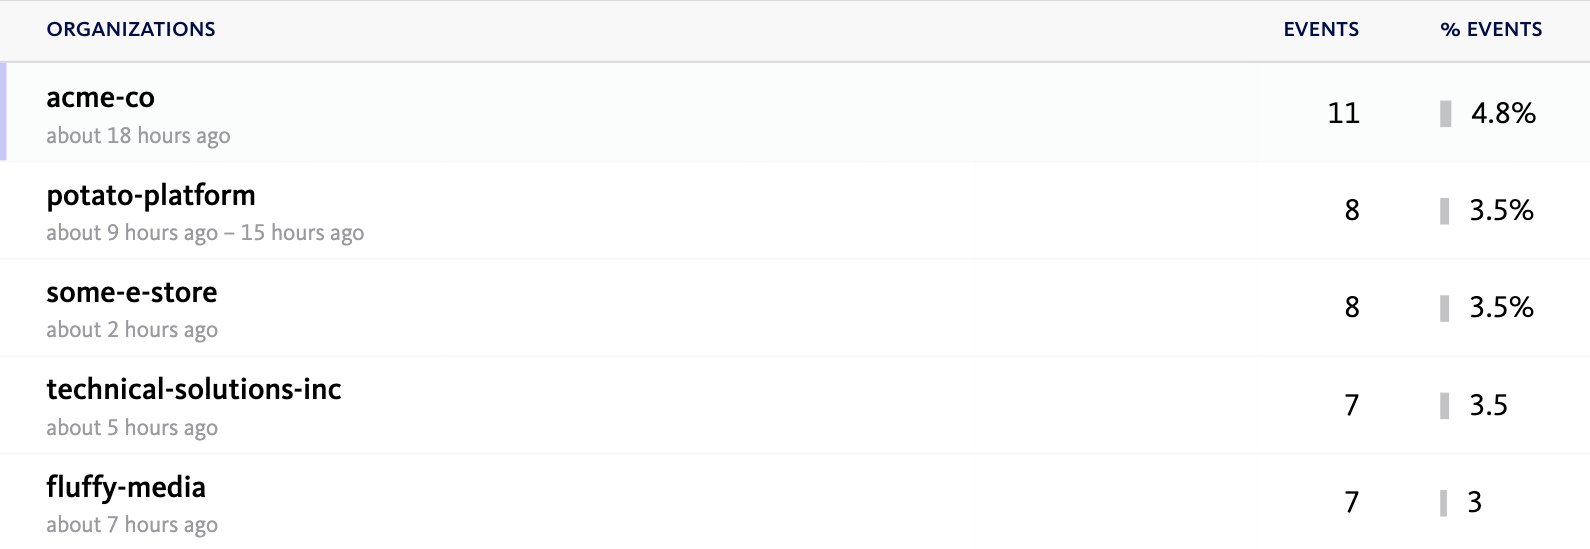
For the final step, we set up a custom filter on organization name. This lets us have a pivot tab in the dashboard that will let us see a list of slow requests aggregated by company:
This tab gives the engineering team a quick way to find organizations to watch when we roll out performance improvements. It’s also a way for our sales & customer success folks to know more about how teams are experiencing the site, so they have more context when they talk to customers. And it helps the team decide whether it’s time to prioritize performance improvements over new features when we’re planning our work.
Monitoring refreshes
As single-page apps have grown more common, so has the experience of dealing with broken single page apps. We all know what it’s like to navigate through a complex series of UI steps only to find that the page looks weird or that clicking an element doesn’t seem to have the expected result. And most of us have developed the same coping skill: hard-refreshing the page. We wanted to track how often users manually refresh the page, to try see if they are running into site issues that we aren’t catching just by listening for errors. Christian Schlensker on the dashboard engineering team set this up:
// Mousetrap is a library for handling keyboard shortcuts that we use elsewhere in the app
import Mousetrap from ‘mousetrap’;// Set up refresh tracking
Mousetrap.bind([‘command+r’, ‘ctrl+r’, ‘f5’], () => {
Bugsnag.notify(‘Page refreshed’, null, {}, ‘info’);
});
Because our customers are primarily developers and many developers make great use of keyboard shortcuts, we assume that tracking keyboard shortcuts like ctrl-r or command-r is likely to capture the majority of refreshes. For some audiences (especially mobile-heavy ones) that may not be true and you may need to use a more complicated heuristic, like tracking page loads where the prior page url (saved in session storage) was identical.
Not surprisingly, we found that the timeline and inbox pages were the most likely to be refreshed. The error data on these pages doesn’t live update yet, so we know many users refresh just to fetch new errors. However, the third most-refreshed page was a surprise: the collaborators list view in Bugsnag’s settings app. We think the use case here is organization admins who are adding new collaborators and wanting to confirm that their teammates are able to access Bugsnag. It’s a good clue to us that we may want to help admins find out when new users are added in the future, either through live updates or some kind of in-app alert.
Rage click detection
The final bit of user frustration tracking we’ve recently added to the site involves detecting “rage clicks.” This is a technique I first heard about from Philip Tellis and Nic Jansma at Velocity 2016. Rage clicks are rapid sequences of clicks that don’t accomplish anything. Typically they happen after a user clicks a UI component, doesn’t get the expected response, tries again, doesn’t get the expected response, and then becomes frustrated and begins to aimlessly click around hoping something will happen. We can track them with Bugsnag like so:
// Set up rage click detection
const CLICK_TIME_THRESHOLD = 500;
const CLICK_COUNT_TRESHOLD = 5;function now() { return (new Date()).getTime(); }
let last = now();
let count = 0;// Only listen for events that bubble up to the window – events that are
// cancelled before hitting window are likely to be handled by the app.
window.addEventListener(‘mouseup’, (e) => {
const current = now();
if ((current – last) < CLICK_TIME_THRESHOLD) {
count += 1;
}if (count > CLICK_COUNT_TRESHOLD) {
const { className, id, nodeName } = e.target;
Bugsnag.notify(‘Rage click’, ”, {
‘last target’: { className, id, nodeName },
});
}
last = current;
});
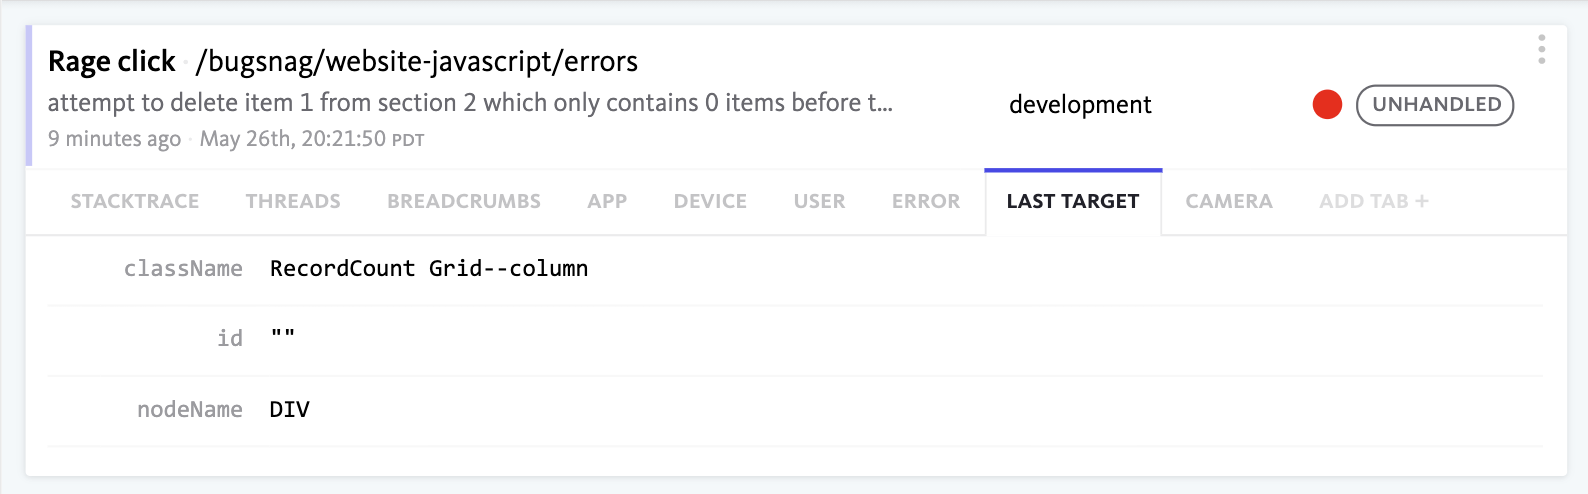
The Bugsnag event also shows us some information about the target of the last click, in addition to standard event metadata like the page url and current user’s name. This gives us a little more information to figure out what component the user was attempting to interact with, so we can try to determine which aspect of our UI was creating frustration.
Conclusion
While we primarily use Bugsnag to find out about exceptions, we can have it tell us a lot more about the user experience with a little instrumentation. In under 100 lines of code, we’re able to add tracking that gives us a much clearer picture of which users and teams are having a frustrating experience on the site and give ourselves a chance to proactively fix pain points before users report them to us.