
New Features Dashboard delivers observability and actionable insights to accelerate feature releases
We’re excited to announce the availability of a new, first of its kind Features Dashboard in Bugsnag to provide development teams the observability and actionable insights they need to make data-driven decisions about new feature rollouts and gain confidence in accelerating releases.
Progressive delivery, feature flags, and experiments
Today, development teams are under increasing pressure to ship new features faster to boost user engagement, retention, and grow competitive advantage. In our recent Application Stability Index, we analyzed release frequencies across 10 major verticals and confirmed that weekly releases are the new norm. Large and infrequent releases have been replaced by smaller and more frequent releases as teams adopt progessive delivery to build, test, and deploy code.
Teams doing progressive delivery use feature flags to ship code faster and minimize risks, like issues slipping into production and impacting the quality of the application and the user experience. Feature flags are a way to manage these risks because they allow teams to deploy when they want, to whom they want, and dynamically adjust in production based on the impact on the user experience.
Experiments or A/B tests are an extension of feature flags where one or more variants are compared to a control group. When the experiment is complete, the most effective variant that meets stability goals is rolled out to all users.
New Features Dashboard
Previously, Bugsnag users could segment errors occurring in feature flags and experiments using custom filters for arrays. With the new Features Dashboard, you can proactively monitor errors in feature flags and experiments.
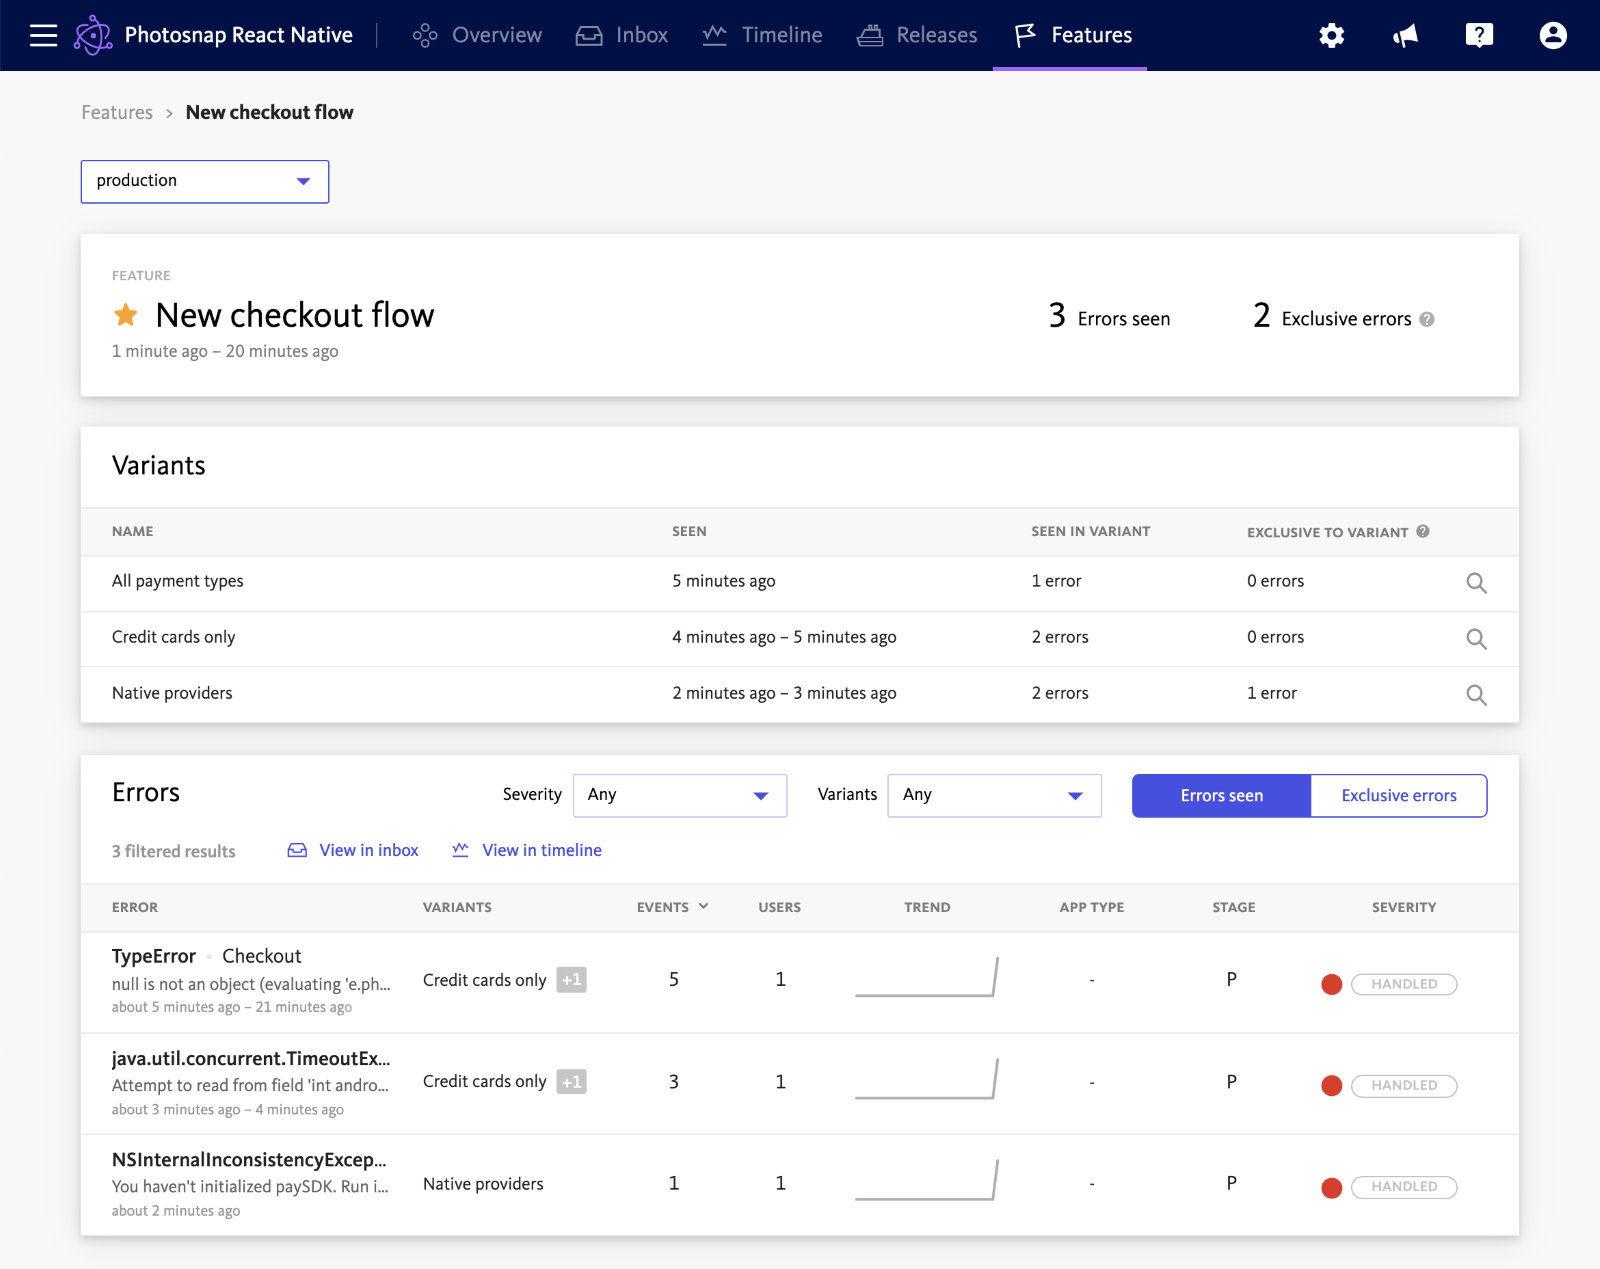
The new feature details page shows errors that occurred when the feature flag or experiment was active. Seen errors are all errors that occurred while a feature flag was active and exclusive errors are errors that only occurred when the feature flag was active and did not occur when it was not active. Exclusive errors should be investigated to determine if they have been introduced by the feature flag or experiment.
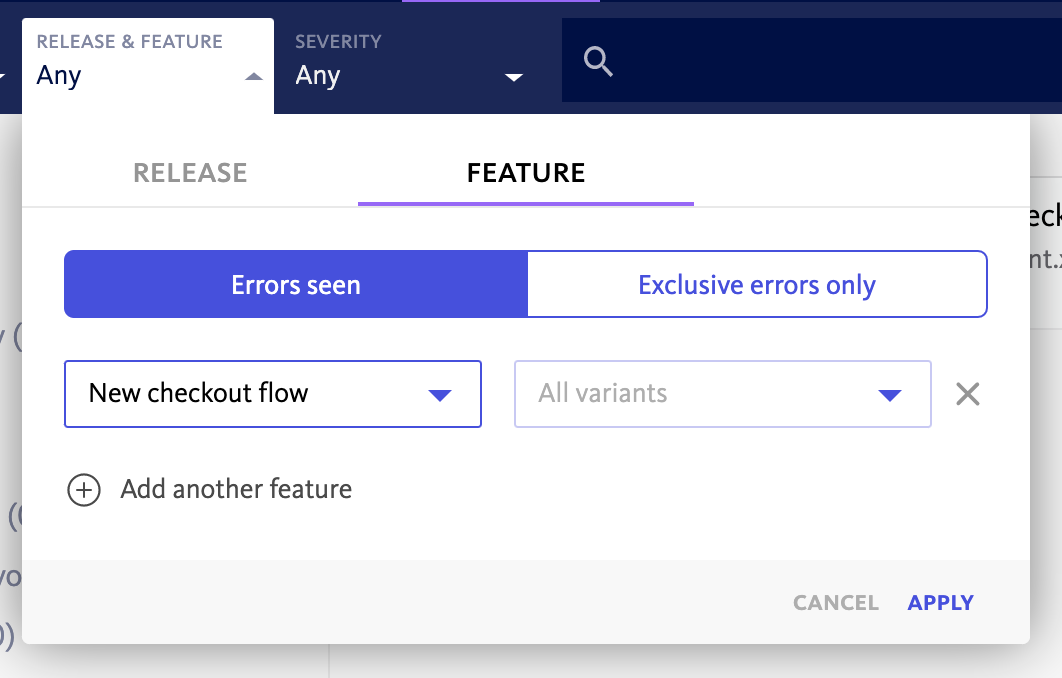
If investigating a spike in errors, you can filter the existing Inbox and Timeline views to identify what features or experiments were turned on and may have been linked to the increase in errors. Additionally, reproducing and fixing any error in the application is more efficient because you can see what features or experiment variants were active at the time of the error.
Let’s dive deeper into the observability and insights delivered by the new dashboard.
Real-time observability for features and experiments
The new dashboard provides you the proactive monitoring needed to understand how feature flags and experiments are impacting the user experience. As feature flags and experiments are rolled out, you can gain real-time insights into errors in the application.
Similar to how alerting can be set up for saved error segments in Bugsnag, alerts can be configured for feature flags so that the team responsible for developing and rolling out a particular feature can be alerted of errors impacting the experience of users who have access to that feature.
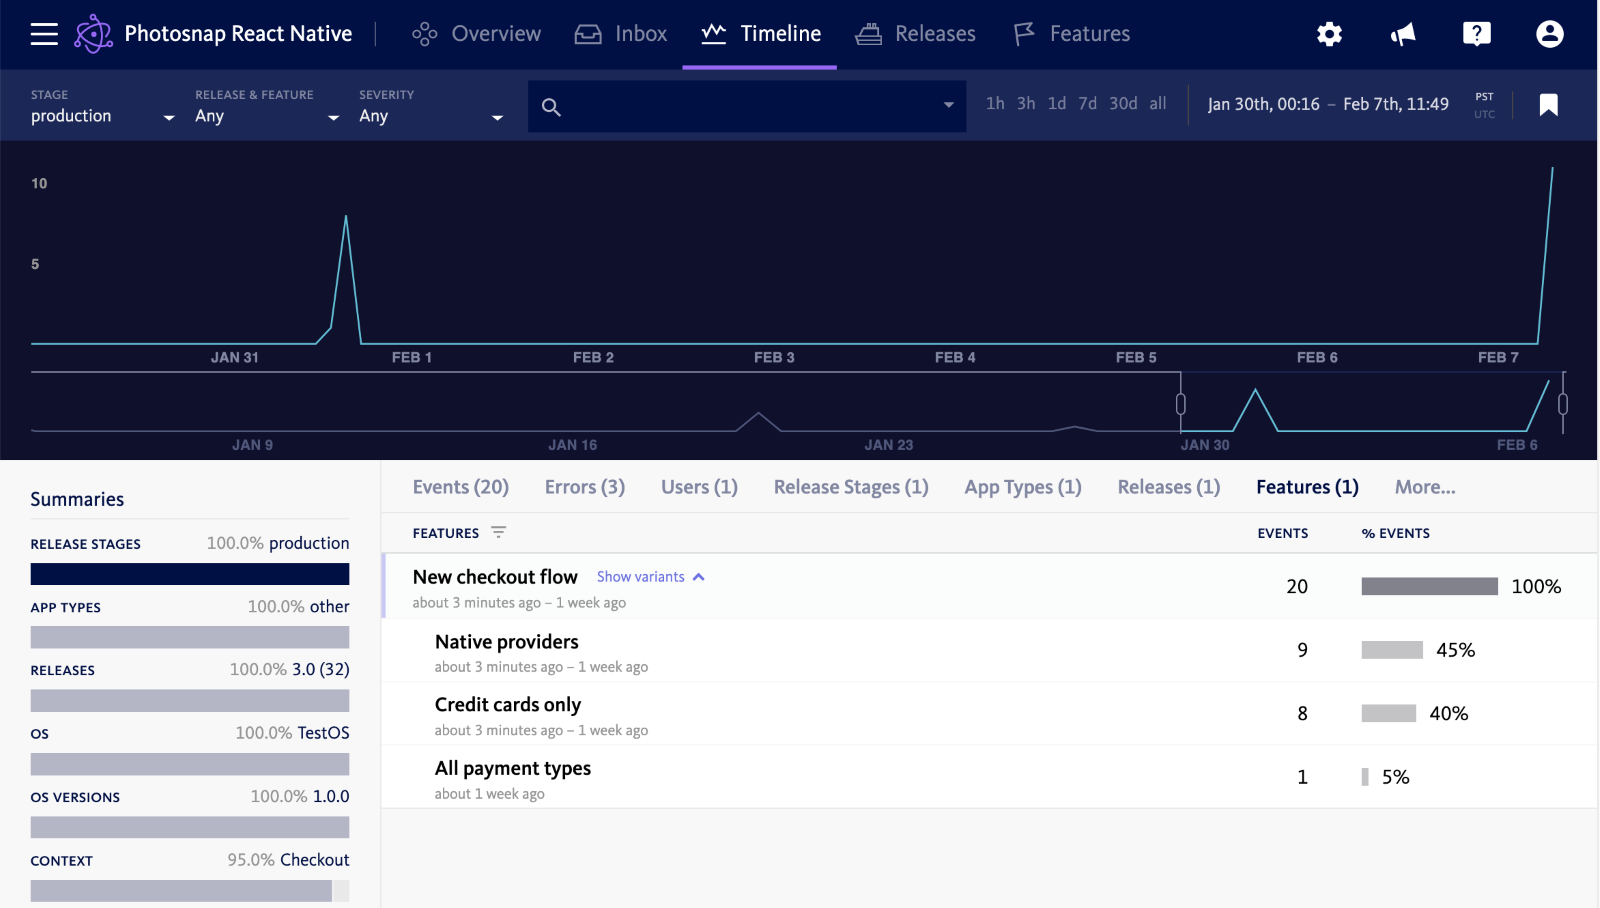
In addition to being able to zoom in on the errors occurring in feature flags, you can also determine if unusual error activity in the application is connected to a feature flag. In the Timeline view, pivot tables for feature flags can be used to isolate errors that occurred when the feature flag was enabled.
Make data-driven decisions about feature rollouts
Teams using progressive delivery phase the roll out of features to their users to get their code in front of early adopters and limit the blast radius of any issues that may come up. Phased rollouts are basically when you progressively increase the number of users that are able to see and are impacted by the new feature or experiment.
Now, with the actionable insights in the Features Dashboard, you can make data-driven decisions about feature rollouts. Monitor the impact of features and experiments on application quality and user experience to inform decisions about continuing the phased rollout and releasing a feature to more users if there aren’t too many errors or rolling back if there are issues that need to be addressed first. If running an experiment, you can see the errors in each variant and decide which one meets your quality standard to be released to production.
Gain confidence in accelerating new feature releases
We mentioned that development teams are under increasing pressure to ship new features faster to boost user engagement, retention, and grow competitive advantage. However, moving faster comes with risks, like more errors being introduced into production and decreasing the quality of the user experience.
The new Features Dashboard helps you speed the pace of delivery while minimizing these risks. With proactive monitoring for feature flags and experiments, you can discover and fix issues with new features when they are exposed to a smaller subset of users and then re-release a more stable version into production. You can gain confidence in releasing to production knowing that the feature will not degrade the quality of the user experience.
Start using the Features Dashboard today
The Features Dashboard is currently available for client-side applications, including Android, iOS, React Native, Unity, Unreal Engine, Expo, JavaScript (browser and Node.js), and Electron. Additional platforms will be supported soon.
If you’re a current Bugsnag user, start monitoring features and experiments in the new Features Dashboard today by configuring the Bugsnag library in your application. Learn more by reading our documentation, which includes guides for each platform.
If you’re new to Bugsnag, start a 14 day free trial or request a demo to see the capabilities of our stability management platform in action.