
7 Best Practices for JavaScript Error Monitoring
As is the experience for most B2B SaaS engineering teams, one question we get asked often is, “Do you use Bugsnag yourself?” The answer is, “We do”. Additionally, we at Bugsnag believe that in order to provide the best error monitoring and stability management solution, we must also be the pioneers and thought leaders when it comes to technical debt, application health, and efficient debugging workflows.
So yes, we use Bugsnag to monitor Bugsnag — everything from our Rails API to our React Dashboard. And as experts on application error monitoring, we would like to share with you our top seven best practices for monitoring errors in JavaScript applications. JavaScript applications have their own unique challenges when it comes to catching exceptions. Given the plethora of internet browsers, versions, bots, and other variables, it’s often tempting to just ignore the noise.
While debugging apps is our bread and butter, we also know as software engineers that a successful user experience rests on more than just software stability, including performance and reliability. It’s smart to consider the size of your JavaScript application as it can affect speed and load times. You can read our blog on How to Make Your JS Bundle Really Small In 4 Easy Steps for helpful tips from our Platforms Engineer, Ben Gourley!
Alright, let’s move past this intro and get into the good stuff. This guide comes to you from our Solutions Engineer, Rosty Sokolov. He works closely with our customers who range from SMBs to large enterprise engineering organizations, and he’s picked up several tips for optimizing your error monitoring for JS apps. We hope you enjoy reading through this guide on Best Practices for JavaScript Error Monitoring. If you find yourself left with some more questions or would like to pick our brains, give us a shout on Twitter @bugsnag, and we’ll be happy to engage with you!
1. Configure allowed domains
Configuring allowed domains is a powerful way to eliminate many of the noisy JavaScript errors you don’t care about. Bugsnag allows you to add your domain to a list of allowed domains, so you can automatically ignore errors that happen on other domains, even if they’re using your API key. This way, you can focus solely on the errors you know are coming from your JavaScript code.
For instance, if you load some debugging scripts or third-party scripts from another domain, configuring allowed domains lets you automatically ignore errors from those scripts. It also saves you some trouble on the chance that someone copy-pastes all your JavaScript onto another website or a local file and starts doing weird stuff with it that throws errors — something that is sadly common for large sites.
2. Strip out exceptions from browser extensions
Browser extensions are a challenge when it comes to setting up good frontend monitoring. Beyond the multitude of browsers to choose from, each is also unique because of the wide range of browser extensions your users can install. Some will likely cause your JavaScript to crash, creating noise you’ll want to ignore. Since these crashes will mostly be unrelated to your code, stripping them out is a good strategy for configuring your frontend error monitoring.
In Bugsnag, we automatically ignore errors with browser extension files in the stacktrace, so there’s zero configuration needed to deal with browser extensions in most cases.
3. Ignore old browsers
Older versions of browsers are much harder to deal with since they’re more prone to crashing, and many don’t even give you stacktraces with error reports. Since fewer users still run these older versions, they may be less important to support. By silencing notifications for crashes in older browser versions, you can focus on fixing errors impacting the majority of users.
4. Use source maps
Probably the most helpful piece of information you will use to debug in JavaScript — and in any language, for that matter — is the specific line of code that crashed. Most of you likely minify your JavaScript code. If that’s the case, you will need to setup source maps. Source maps, as the name implies, map your minified code to your actual lines of code. They automatically un-minify errors so that what you see in Bugsnag is instantly readable and recognizable.
Another benefit of using source maps is related to how Bugsnag groups your errors. Bugsnag groups errors by the same root cause, and source maps allow us to apply our grouping logic to your code. For example, in JavaScript, we’re able to group according to the surrounding code by using abstract syntax trees that replace any identifiers (variable names, function names, etc.) and by applying a general structure that groups code reliably.
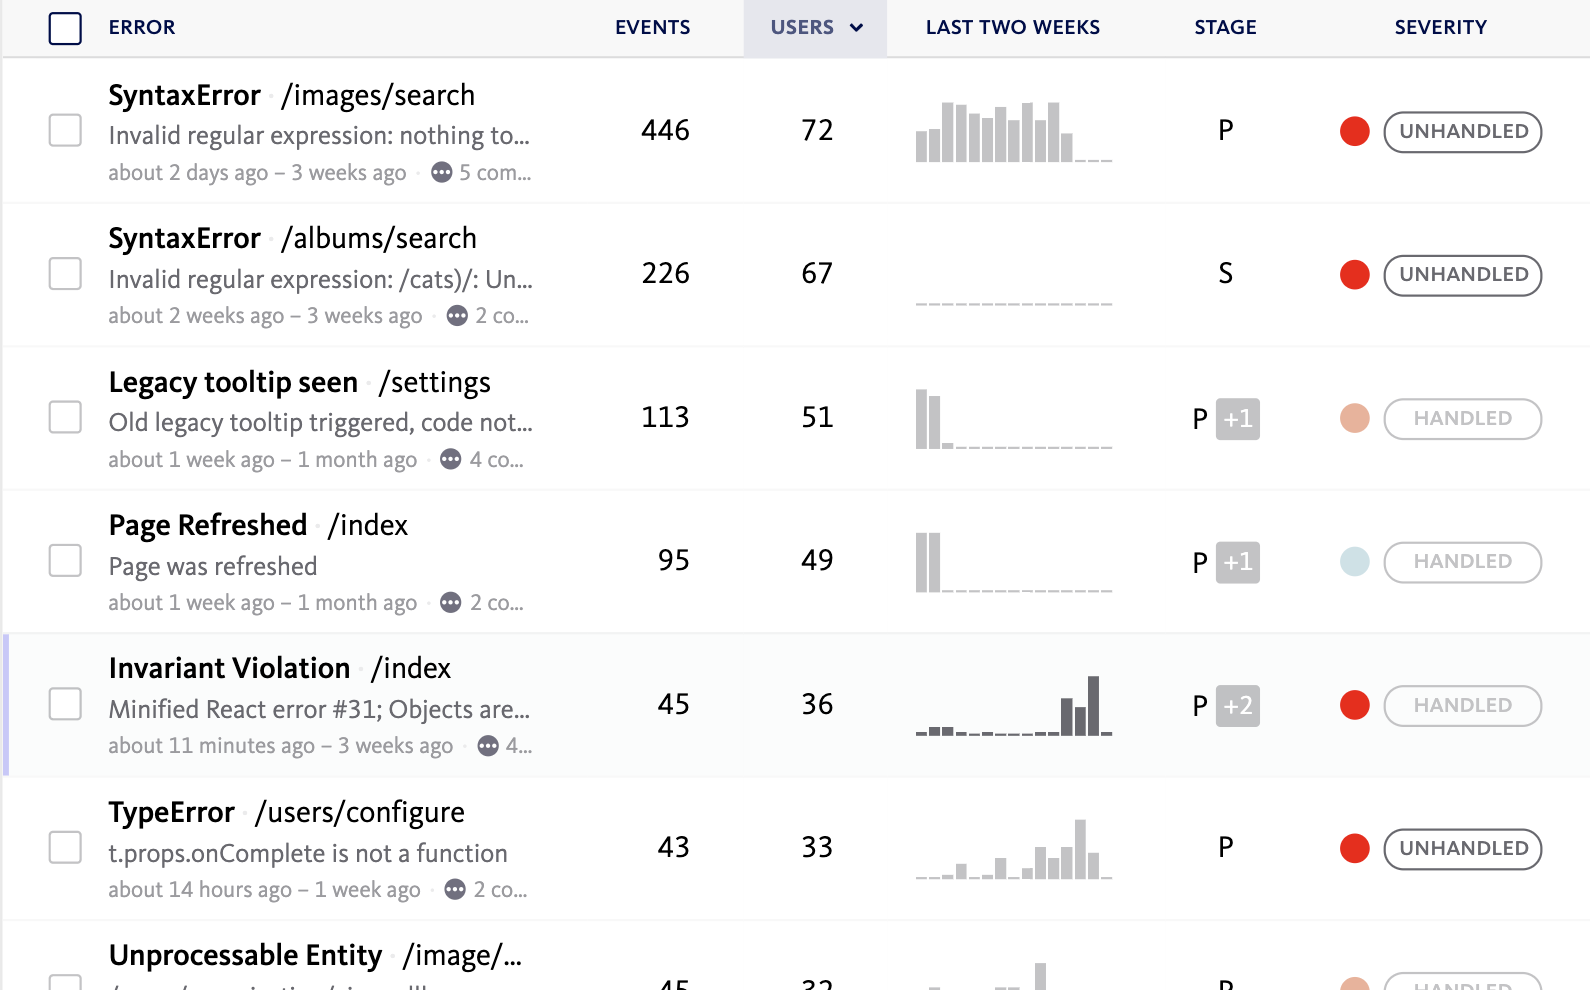
5. Prioritize errors by users affected
JavaScript monitoring can be noisy, so looking at raw error counts alone will not give you a comprehensive overview of your app’s health. In some cases, a serious spike in errors might only be affecting a single user. While you can definitely spend time investigating that error, most likely it isn’t worth your time. If you can begin to prioritize errors based on how many users are affected, you can begin to make data-driven decisions and take a pragmatic approach to debugging.
Stepping back from the lens of a single error and considering the overall health of your app, you will want to consider user stability, which is one of the two ways you can measure application stability. Spoiler alert: Bugsnag measures both! Stability can be calculated as a percentage of successful sessions over a period of time (session stability) or as a percentage of users who’ve experienced successful sessions over a period of time (user stability). You can easily view these scores in the Stability Center and toggle between which calculation of stability you prefer to view by default.
6. Filter for bot traffic
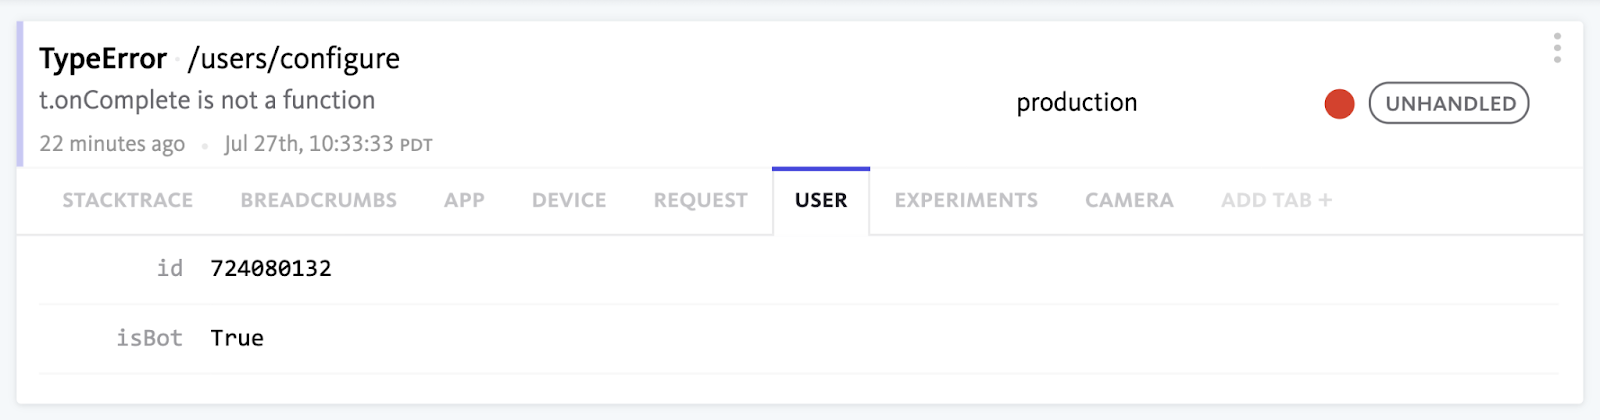
Bot traffic describes any non-human traffic to a website or an app. While some bot traffic is beneficial, abusive bot traffic can be very disruptive. Distinguishing between bots and real users is important when it comes to error monitoring. For instance, if your website is seeing a huge spike in errors coming from real users, this likely requires immediate attention. On the other hand, if a spike in errors is attributed to bots, attention should go towards managing bot traffic. This can save your team a significant amount of time wasted on debugging.
It’s common for JS teams to have tools in place to identify bot traffic. Using Bugsnag’s custom filters, you can get an understanding of the impact that bots have on your application stability. With the help of custom metadata, your team can leverage bot diagnostics to identify if a user is a bot.
You can even create a bookmark to conveniently access errors excluding bot traffic.
7. Assign version numbers to your JS
People can keep a single browser window open for days without refreshing it, so there’s no guarantee that your current deployment includes the code that caused an error. In Bugsnag, we allow you to easily track JavaScript deployments by assigning version numbers. Assigning your JavaScript a unique version number lets you know whether you truly fixed a bug with the latest deploy (and maybe you’re noticing a handful of errors coming in from older versions), or if you’re still seeing the same bug hanging around in your new code.
———
We hope you enjoyed reading this guide on Best Practices for JavaScript Error Monitoring. Were there any new tips above that you haven’t tried before? There’s plenty more to discover and to discuss when it comes to JavaScript errors. To start, you can read our blog on the Anatomy of a JavaScript Error. If you are new to Bugsnag, we encourage you to explore our website and learn more about Bugsnag’s JavaScript error monitoring. Or you can get started today and sign up for a free 14-day trial.