
Microservice developer tools for Gophers
Do you write microservices? Do you perhaps also write these in Go? Then it’s worth being aware of these tools for making the development process extra smooth. These tools are mostly aimed at Go developers writing microservices, but some (e.g. ghz, ctop, and grpcui) are language and platform agnostic. A lot of the tools assume that there’s an application already existing somewhere. If you would like to try out these tools for yourself please feel free to play with this repository especially set up for this article.
The go Toolchain is Full of Good Stuff
Go was built with empathy for the developer and as a result, the go command comes with some really nice tools. I won’t attempt to do these tools any justice, so where applicable I’ve provided links to some excellent resources that dive deeper into these tools. With no other dependencies than just the go command itself you can:
- Benchmark the current package by calling
go test -bench=.. This assumes that you have writtenBenchmarkFoofunctions in this package. - Generate and view the coverage of your tests in a nice web interface with
go test -coverprofile=c.outfollowed bygo tool cover -html=c.out. - Identify bottlenecks in your application by profiling with
go tool pprof. It’s surprisingly easy to get a really nice graphical view of where your application spends its resources. - Identify race conditions in your application by running your tests to explicitly try and discover these. You can do this by passing the
-race flagtogo test. This tool finds a large percentage of race conditions, although it’s not 100%. On the other hand, I have never seen it incorrectly flag something as a data race. - View the documentation for any package with
go doc, for examplego doc github.com/bugsnag/bugsnag-go.Configure. If you prefer a web interface you may wish to check out the godoc tool (one word). - Understand why your go module has a certain dependency with
go mod why $DEPENDENCY, e.g.go mod why -m github.com/sirupsen/logrus.
Panics are evil, but let’s make them useful with panicparse
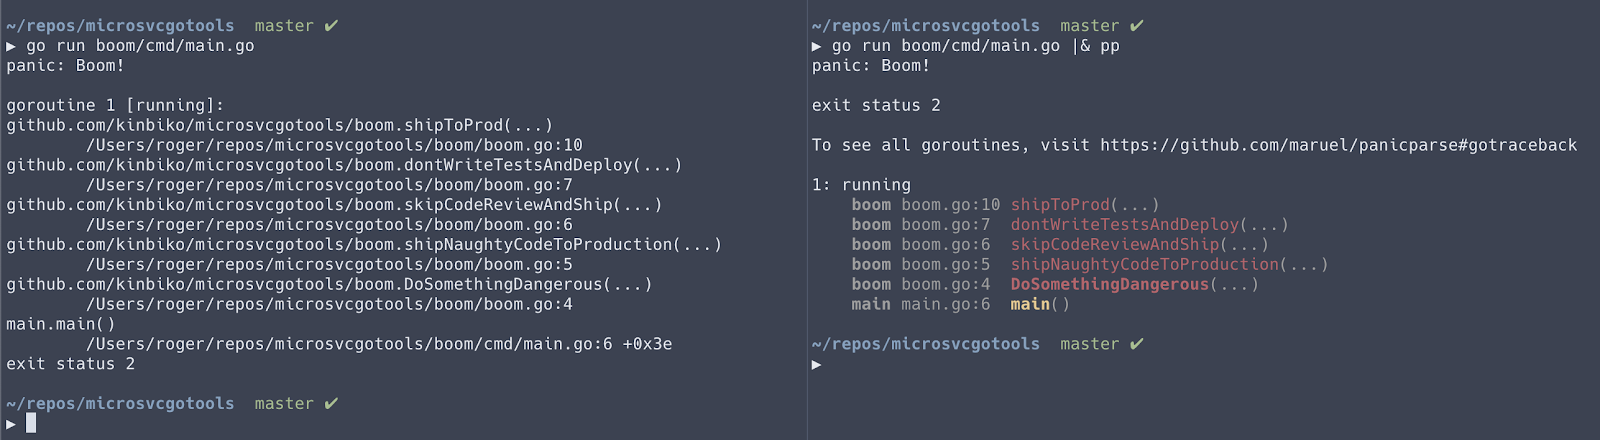
There’s a fantastic tool called panicparse that you can pipe your program output into, and if it detects a panic, it will pretty-print it so you can quickly identify what went wrong.
go get github.com/maruel/panicparse/cmd/pp
# Depending on how your $PATH variable is set up, `pp` might be interpreted
# as the Perl package manager
alias pp="$GOPATH/bin/pp"
To run it, use |& to stream both STDOUT and STDERR into pp, which will continue to stream to STDOUT until it has identified a panic, at which point it will start pretty printing.
Here’s an example output comparison with and without using panicparse:
panicparse is awesome, now forget about it
At Bugsnag, we’re experts at processing panics and have to deal with panics on a regular basis, and this little tool has been a blessing. Unfortunately, you probably want to use this tool before something bad happens, but bad things are generally unexpected. To ensure you can get right into debugging panics, consider creating aliases or functions in your .bashrc or .zshrc file for your most common go commands, where you also pass the output to pp.
alias gt="go test -timeout 3s ./... 2>&1 | pp"This way, you don’t have to run any commands again after you discover a panic, and you’re sorted if the panic only happens sporadically.
Writing gRPC endpoints, but wish you had Postman? Use gRPCurl
REST APIs are great because of their tried and tested nature, and the mature tooling in the developer ecosystem such as Postman. Unfortunately, a lot of companies are finding that REST APIs don’t do the trick any more. This is true at Bugsnag as well, and we’re now using gRPC for synchronous communication in our internal services. If you would like to learn more about gRPC, how it works and why we’re using it, please check out this article by my coworker. Sadly, this meant that we couldn’t use tools like Postman anymore, but thankfully there’s a solution.
gRPCurl is a command line tool that lets you interact with a gRPC server using JSON, and makes it easy to read the response as well.
In the associated repository we have a GetFizzBuzzSequence gRPC endpoint whose protobuf file resides in fizzbuzz/fizzbuzz.proto for calculating the answers to the infamous FizzBuzz interview question. You can follow these instructions to run a demo gRPC server. We can then use gRPCurl to hit the endpoint defined in this protobuf file with the following command.
grpcurl \
-proto fizzbuzz/fizzbuzz.proto \
-plaintext \
-d '{"start": 1, "end": 100}' \
localhost:1234 \
fizzbuzz.FizzBuzz/GetFizzBuzzSequence
The -proto flag defines the protobuf file, so that grpcurl knows what request and response to expect. The -plaintext flag specifies that we’re sending the data unencrypted for this simple example. The -d flag defines the JSON representation of a request body that will be mapped into the equivalent gRPC request. The positional arguments are the host + port that the gRPC server is running on, as well as the name of the endpoint to hit in a ${package}.${ServiceName}/${Method} format.
I find it very difficult to remember and edit this entire command, so instead of memorising the command, I create a temporary grpcall alias for the particular gRPC server I’m using at the time. The following alias works because grpcurl interprets @ to mean read from STDIN.
alias grpcall="grpcurl -proto fizzbuzz/fizzbuzz.proto -plaintext -d @ localhost:1234 fizzbuzz.FizzBuzz/GetFizzBuzzSequence"
echo '{"start": 1, "end": 100}' | grpcallOr even:
cat my-file.json | grpcall
I wanted Postman but you gave me curl! Enter: gRPCui
gRPCurl is fine and all, but a lot of the time you don’t want to fiddle with getting the syntax just right. You want a more user friendly interface, that will be as about as useful as gRPCurl but much easier to use. That tool is grpcui.
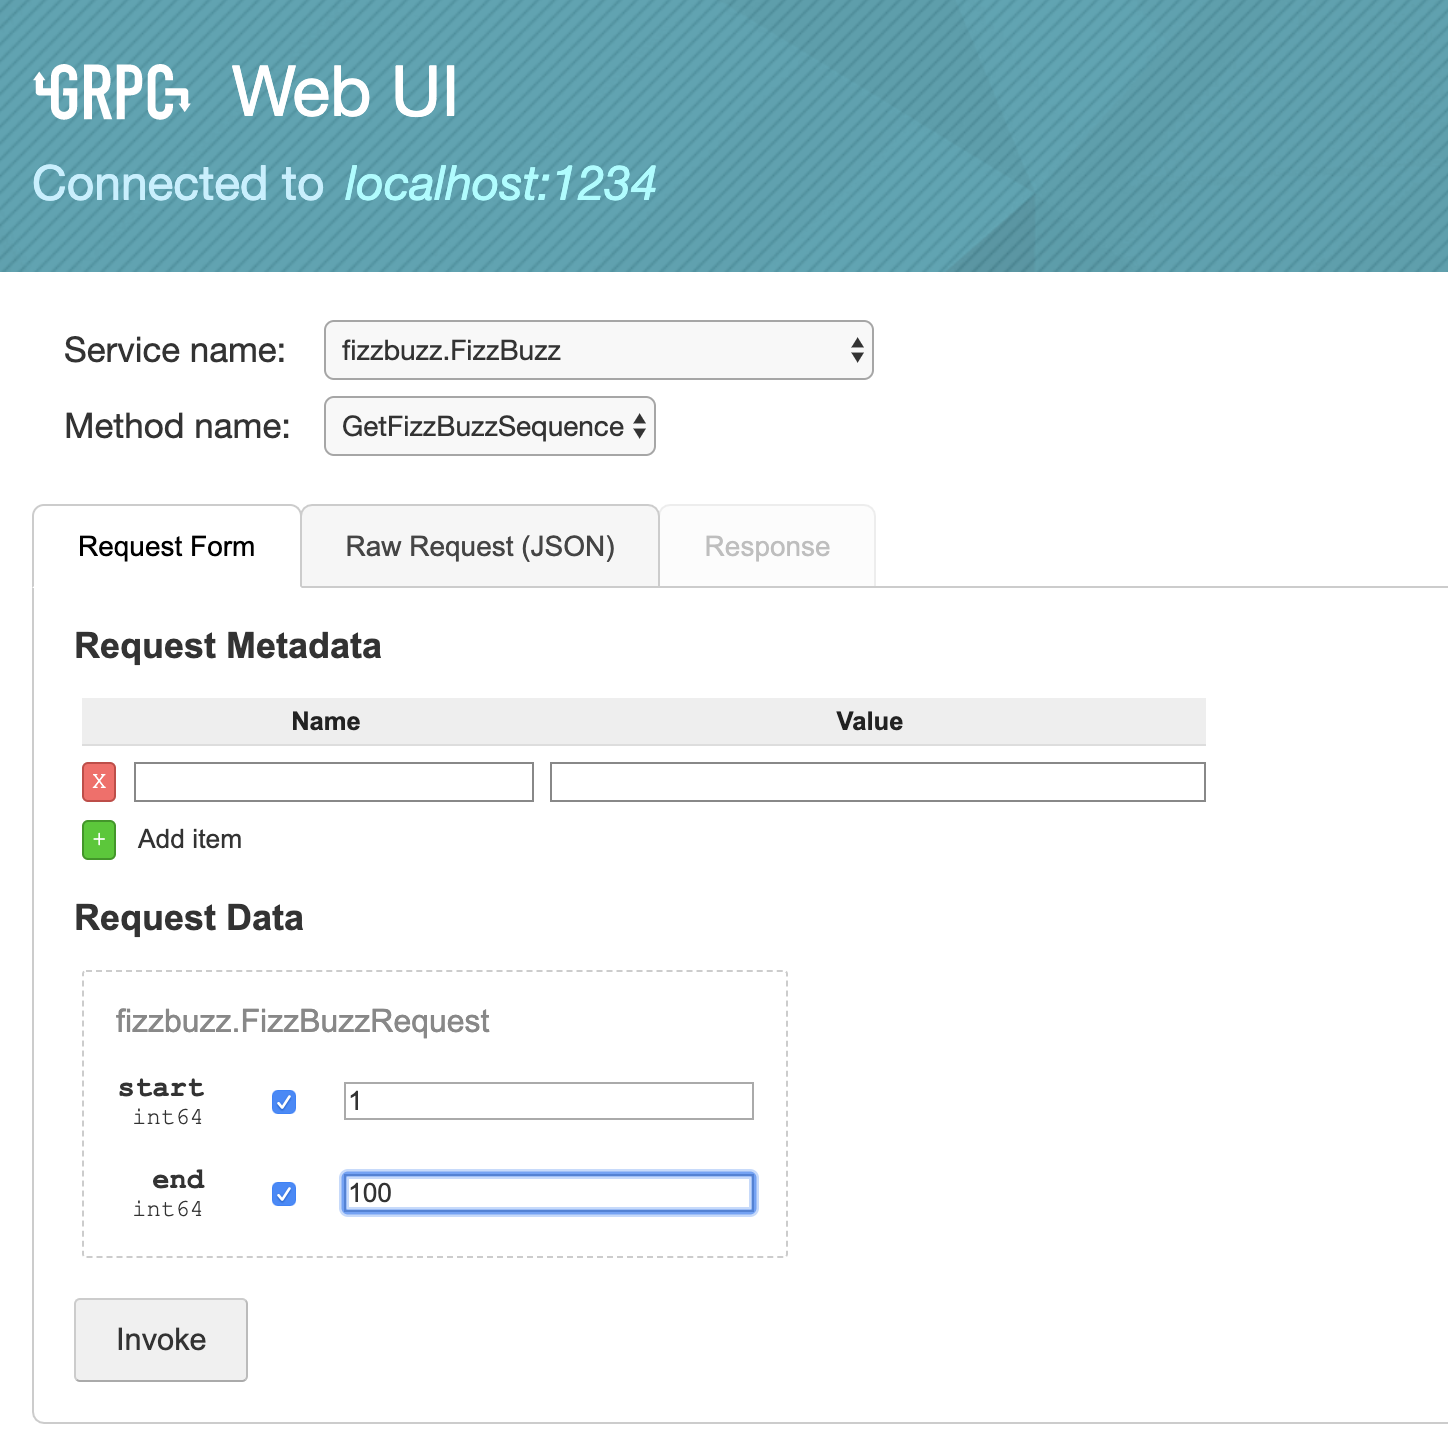
You can use grpcui in a similar manner to how gRPCurlworks, but even simpler:
grpcui -proto fizzbuzz/fizzbuzz.proto -plaintext localhost:1234Alternatively, you could enable reflection when creating your gRPC server, e.g.
import (
	//...
	"google.golang.org/grpc/reflection"
)
// ...
	reflection.Register(myGrpcServer)
And then you don’t even need to specify the protobuf file:
grpcui -plaintext localhost:1234Note that if you are using gRPC to stream messages then this is a bit awkward in grpcui, and you may wish to fall back to gRPCurl in this case.
I have also heard good things about BloomRPC, which runs natively on your computer just like Postman. Unfortunately, at the time of writing BloomRPC does not support gRPC server reflection so you will have to have the protobuf files at hand.
Load testing services with ghz
There are quite a few tools for load testing HTTP endpoints, but not so many for gRPC. The best tool I’ve found is ghz, which is inspired by hey and grpcurl. The tool is highly customizable, and will feel familiar to anyone comfortable with grpcurl.
For example:
ghz \
--insecure \ # Equivalent of -plaintext for grpcurl
-d '{"start": 1, "end": 600}' \ # Data to send, just like grpcurl
-c 100 \ # Number of concurrent requests to make
-n 5000 \ # Number of total requests to make
--call=fizzbuzz.FizzBuzz/GetFizzBuzzSequence \ # Endpoint to hit, like grpcurl
--connections=5 \ # Number of different gRPC connections to make
localhost:1234 # host:port
will give you a nice view of how long the requests took:
Summary:
  Count:        5000
  Total:        400.47 ms
  Slowest:      16.16 ms
  Fastest:      0.23 ms
  Average:      7.74 ms
  Requests/sec: 12485.20
Response time histogram:
  0.234 [1]     |
  1.826 [62]    |∎∎
  3.419 [48]    |∎
  5.011 [264]   |∎∎∎∎∎∎∎
  6.603 [1027]  |∎∎∎∎∎∎∎∎∎∎∎∎∎∎∎∎∎∎∎∎∎∎∎∎∎∎∎
  8.196 [1527]  |∎∎∎∎∎∎∎∎∎∎∎∎∎∎∎∎∎∎∎∎∎∎∎∎∎∎∎∎∎∎∎∎∎∎∎∎∎∎∎∎
  9.788 [1322]  |∎∎∎∎∎∎∎∎∎∎∎∎∎∎∎∎∎∎∎∎∎∎∎∎∎∎∎∎∎∎∎∎∎∎∎
  11.380 [580]  |∎∎∎∎∎∎∎∎∎∎∎∎∎∎∎
  12.973 [134]  |∎∎∎∎
  14.565 [29]   |∎
  16.157 [6]    |
Latency distribution:
  10% in 5.31 ms
  25% in 6.42 ms
  50% in 7.78 ms
  75% in 9.08 ms
  90% in 10.21 ms
  95% in 11.00 ms
  99% in 12.62 ms
Status code distribution:
  [OK]   5000 responses
Profiling your microservice with pprof and ghz to find bottlenecks
We can combine this with pprof from the standard library to profile our code, i.e. identify exactly where the bottlenecks are in our application. Let’s try this against the fizzbuzz gRPC server.
 # Here 'main' is the binary of the running gRPC server
 go tool pprof -http=":" main http://localhost:4321/debug/pprof/profile
By default, pprof spends 30 seconds generating the profile, so for best results give your application traffic for at least 30 seconds. The quickest way of doing this is by modifying the -n flag in the ghz command. Once the pprof server has generated the profile, pprof will open your browser with an interactive UI for you to explore.
From this view of the generated profile for the fizzbuzz example we can tell that a fair bit of the time we were profiling for was spent on logging.
Note: Profiling with pprof works for all Go applications, not just gRPC services. You just need another tool to generate the traffic other than ghz.
Manage your Docker containers with ctop
Chances are, if you’re developing services in the cloud these days you’re using Docker. Docker, like go itself, comes with many useful subcommands, but remembering them all can get tedious. ctop is docker stats on steroids. It’s a terminal user interface (TUI) where you can see and interact with all your running docker containers. It’s so well designed that I’d use it even if I only had a single docker container running.
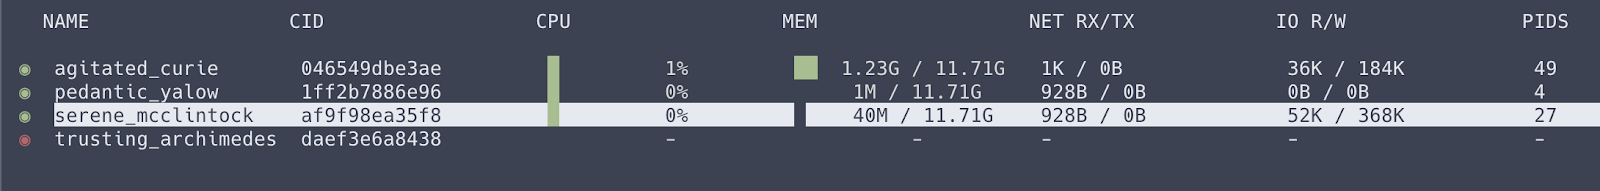
With ctop it’s easy to:
- See statistics of all your containers similar to
docker stats. - Filter and search for specific containers.
- Sort containers based on basically any property.
- Dive deeper into a single container and get a view of it’s stats in a dashboard.
- See the logs of a container.
- Start/stop/restart/pause containers.
Develop with confidence
I hope your developer experience has improved slightly after learning about a new tool or two mentioned in this article. One of the greatest strengths of Go is the inclusive community. It’s this community that has made all of these amazing tools mentioned above, oftentimes in the authors’ own time. Be sure to send some love to the authors of the tools you’re using, for example by starring the repo on GitHub, or tweeting about it.