What’s the Difference Between Observability & Monitoring?
Many people confuse monitoring and observability. While the words have similar definitions, they have significantly different meanings in a DevOps context. It’s critical to understand these differences to select the best quality assurance and bug tracking solutions for your project – and ultimately minimize the number of bugs reaching production.
Let’s look at the similarities and differences between monitoring and observability and how you can pair the two strategies to minimize the number and severity of bugs reaching production.
Monitoring and observability may have similar definitions, but they’re completely different concepts in a DevOps context.
Defining Monitoring & Observability
Monitoring systems watch a predefined set of metrics and logs to detect known failure modes. For example, you might look at response time metrics to spot potential scalability problems. If response times increase, you might spin up new servers to ease the load. You can also look at long-term trends to predict future performance issues.
Observability systems help you understand a system’s internal status from its external outputs. While observable systems have monitoring in place, they go a step further and track down the root cause of problems within the application stack. In other words, it helps move beyond what happened and when to understand why it happened and how to fix it.
Observability also identifies problems that aren’t known. For example, monitoring systems may identify increased response times, but observability might pin a database query as the root cause. As a result, you may be able to implement a simple query change rather than paying for new server capacity.
The “Three Pillars” of Observability
Observability consists of three “pillars” – logs, metrics, and traces. While monitoring metrics, identify problems, logs and traces help diagnose the root cause of these problems by analyzing both the network and the application. As a result, observable systems must include all three pillars to effectively diagnose and resolve bugs.
The three pillars include:
- Logs: Logs receive timestamps and are immutable records of discrete events that provide insight into what happened when things went wrong. You can easily parse logs using visualizations or quickly query them to find information with structured logs.
- Metrics: Metrics are counts or measurements that you can aggregate over time. For example, metrics might track memory usage levels or request throughput, establishing baselines and making it easier to see abnormal behavior.
- Traces: Traces provide a detailed overview of a single request to determine what components caused errors. By monitoring a request throughout an application stack, you can quickly diagnose what’s causing a problem or identify performance bottlenecks.
Observability + Monitoring
Monitoring and observability are not mutually exclusive concepts. Rather, every observable system has monitoring capabilities built-in by definition. Monitoring tells you when something is wrong, and observability helps you understand why. But unfortunately, building observable systems can quickly become a challenge with complex systems.
Some best practices include:
- Identify Key Metrics: Start by identifying the key metrics that apply to your application, such as CPU usage, storage capacity, or transactions per second. Then, set up tracking systems to monitor these metrics and trends over time.
- Structure Your Logs: Implement structured logs that are easy to parse using languages like YAML or JSON. Then, identify solutions like OpenTelemetry that can help you quickly visualize and query logs to find the information you need.
- Effectively Trace: Seek out tracing solutions that work with your application stack to quickly track down the root cause of issues. The best solutions can even help automatically create bug reports and communicate them with the rest of your team.
- Automate Processes: Continuous integration and development (CI/CD) make it easy to automate observability. For instance, you might configure minimum error thresholds for new releases and hold back those with sub-par stability scores.
The Bugsnag Approach
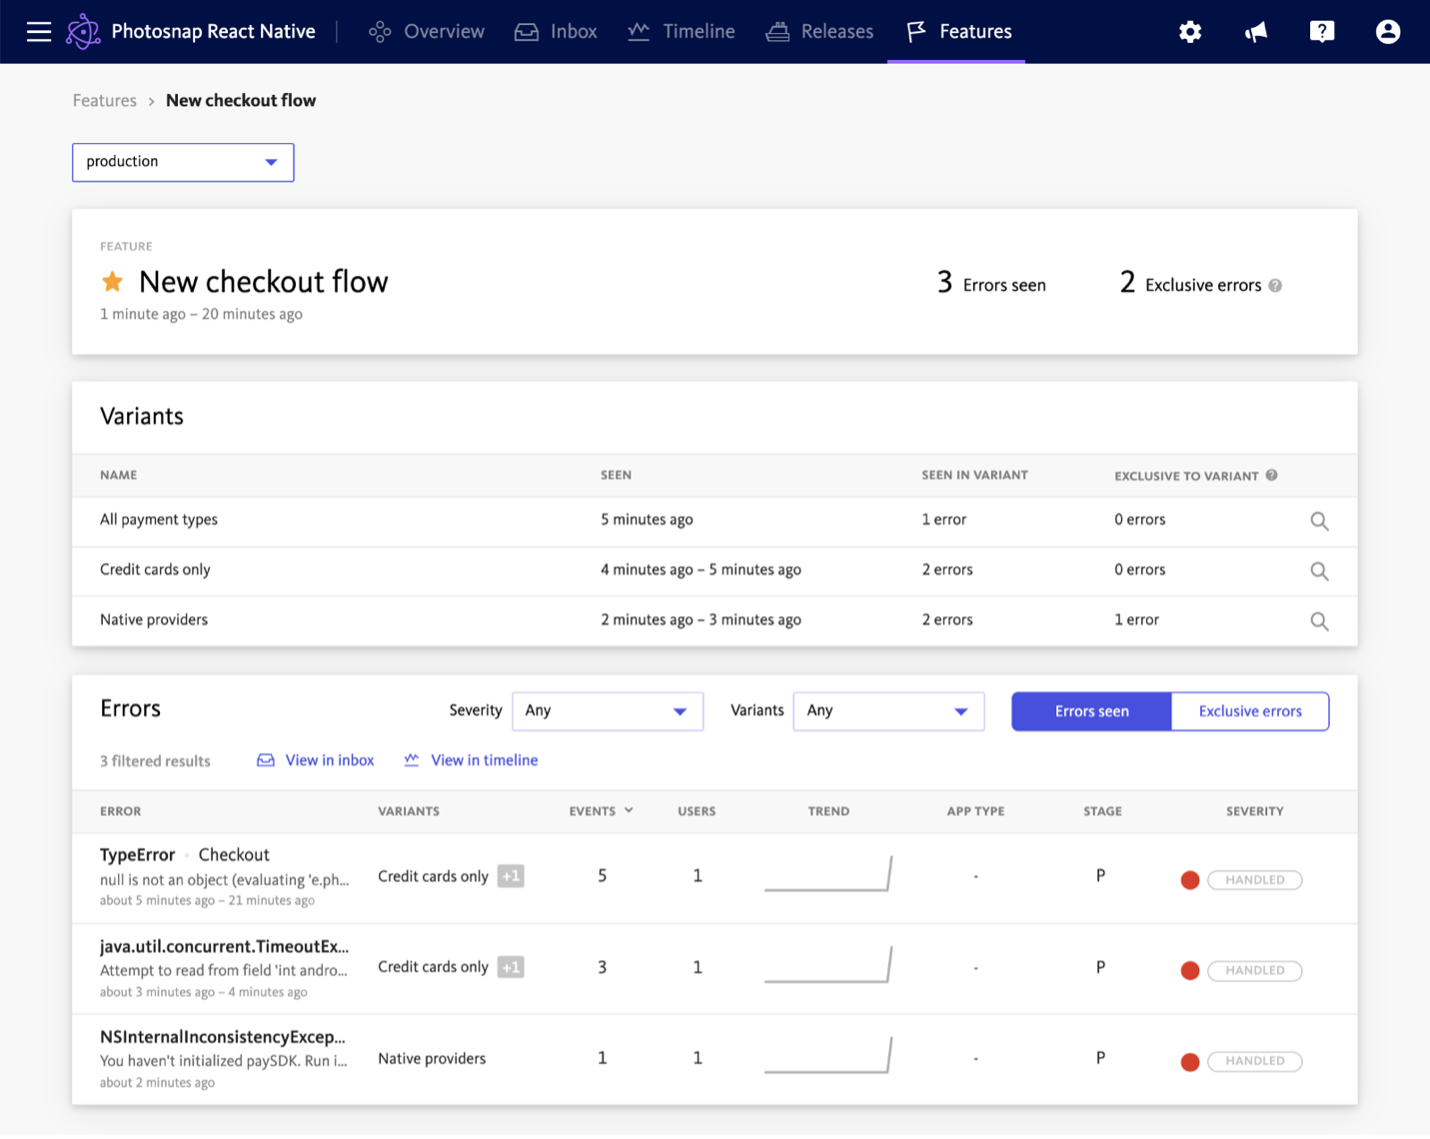
Bugsnag is a robust full-stack observability solution. Unlike conventional monitoring solutions, such as APM tools, the platform provides rich end-to-end diagnostics to help reproduce every error. In addition, Bugsnag’s unique tools help you prioritize bugs, balance bug-squashing with new feature development, and streamline team communication.

There are a few steps to the process:
- Stabilize: Set stability targets that measure the percentage of user sessions in a crash-free release. Doing this allows you to quickly determine if a new release meets minimum stability requirements or if it needs holding back to troubleshoot.
- Prioritize: Prioritize bugs based on their severity by looking at the number of users impacted. In addition, you can use bookmarks to identify errors impacting VIP customers or affecting SLAs. That way, you can focus only on what matters most.
- Fix: Stacktraces make it easy to pinpoint the exact line of code causing issues while retracing user actions that may have led to the error. In addition, you can automatically notify relevant teams based on bookmarks, preventing notification fatigue.
The Bottom Line
Monitoring and observability are critical DevOps concepts, but often they are misunderstood. While monitoring tracks any errors that occur, observability helps identify the root cause of the error to assist in fixing the problems. For example, they can use traces to identify application code responsible for network-level slowdowns.
That said, production applications fail for all kinds of reasons, and there will always be something that goes wrong. The key to success is understanding what’s going wrong and determining what’s worth fixing rather than simply hoping nothing bad happens.
Using all-in-one tools like Bugsnag, you streamline bug tracking and remediation using monitoring and observability tools. It’s the easiest way to spot problems, troubleshoot bugs, and focus on the most impactful activities to build long-term value for your users. At the same time, the platform makes it easy to route problems to the right developers at the right time to fix.
Sign up for a free trial or request a demo today!