
Improve release efficiency and health with the Releases dashboard
We’re pleased to announce the Releases dashboard in Bugsnag — a view to help product teams release new versions of their applications with confidence. The Releases dashboard offers visibility into every release so teams can ship new features faster, with the certainty they’ll know how it impacts their product’s quality and their users’ experience
With the Releases dashboard, engineering teams can:
- confidently release new versions of their product
- immediately gain visibility into release quality
- release new features faster, knowing quality is being maintained and improved
Why focus on releases?
Engineering teams and Release managers know their company’s reputation and users’ goodwill is on the line when product quality goes downhill because of bugs in production. However, understanding and measuring product quality is very difficult with the tools available to most teams. This is a problem the Releases dashboard helps to solve, by offering tangible visibility into software quality. With the error data presented in the Releases dashboard, teams can take action on errors to improve the quality of their product and their users’ experience.
Another major difficulty facing engineering teams is the lack of visibility into the impact of a release. Was the release a success, or does our team need to quickly take action to resolve new issues? Most times, teams wait to see if a deluge of errors or customer support requests will pour in, or if they’re okay. But with the Releases dashboard, there is no need to wait and see what will happen. They can keep an eye on the crash rate and incoming errors to understand if there are issues with the release, or even decide if they need to rollback.
Finally, for managers tasked with deciding how best to spend their engineering resources, it’s a common difficulty trying to figure out how to divide time between building new features, and bug fixes and technical debt. With the Releases dashboard, you can compare releases to see if your quality is improving or getting worse over time. The clarity around product quality and release health can make this decision much easier so managers can move ahead decisively.
How can I use the Releases dashboard?
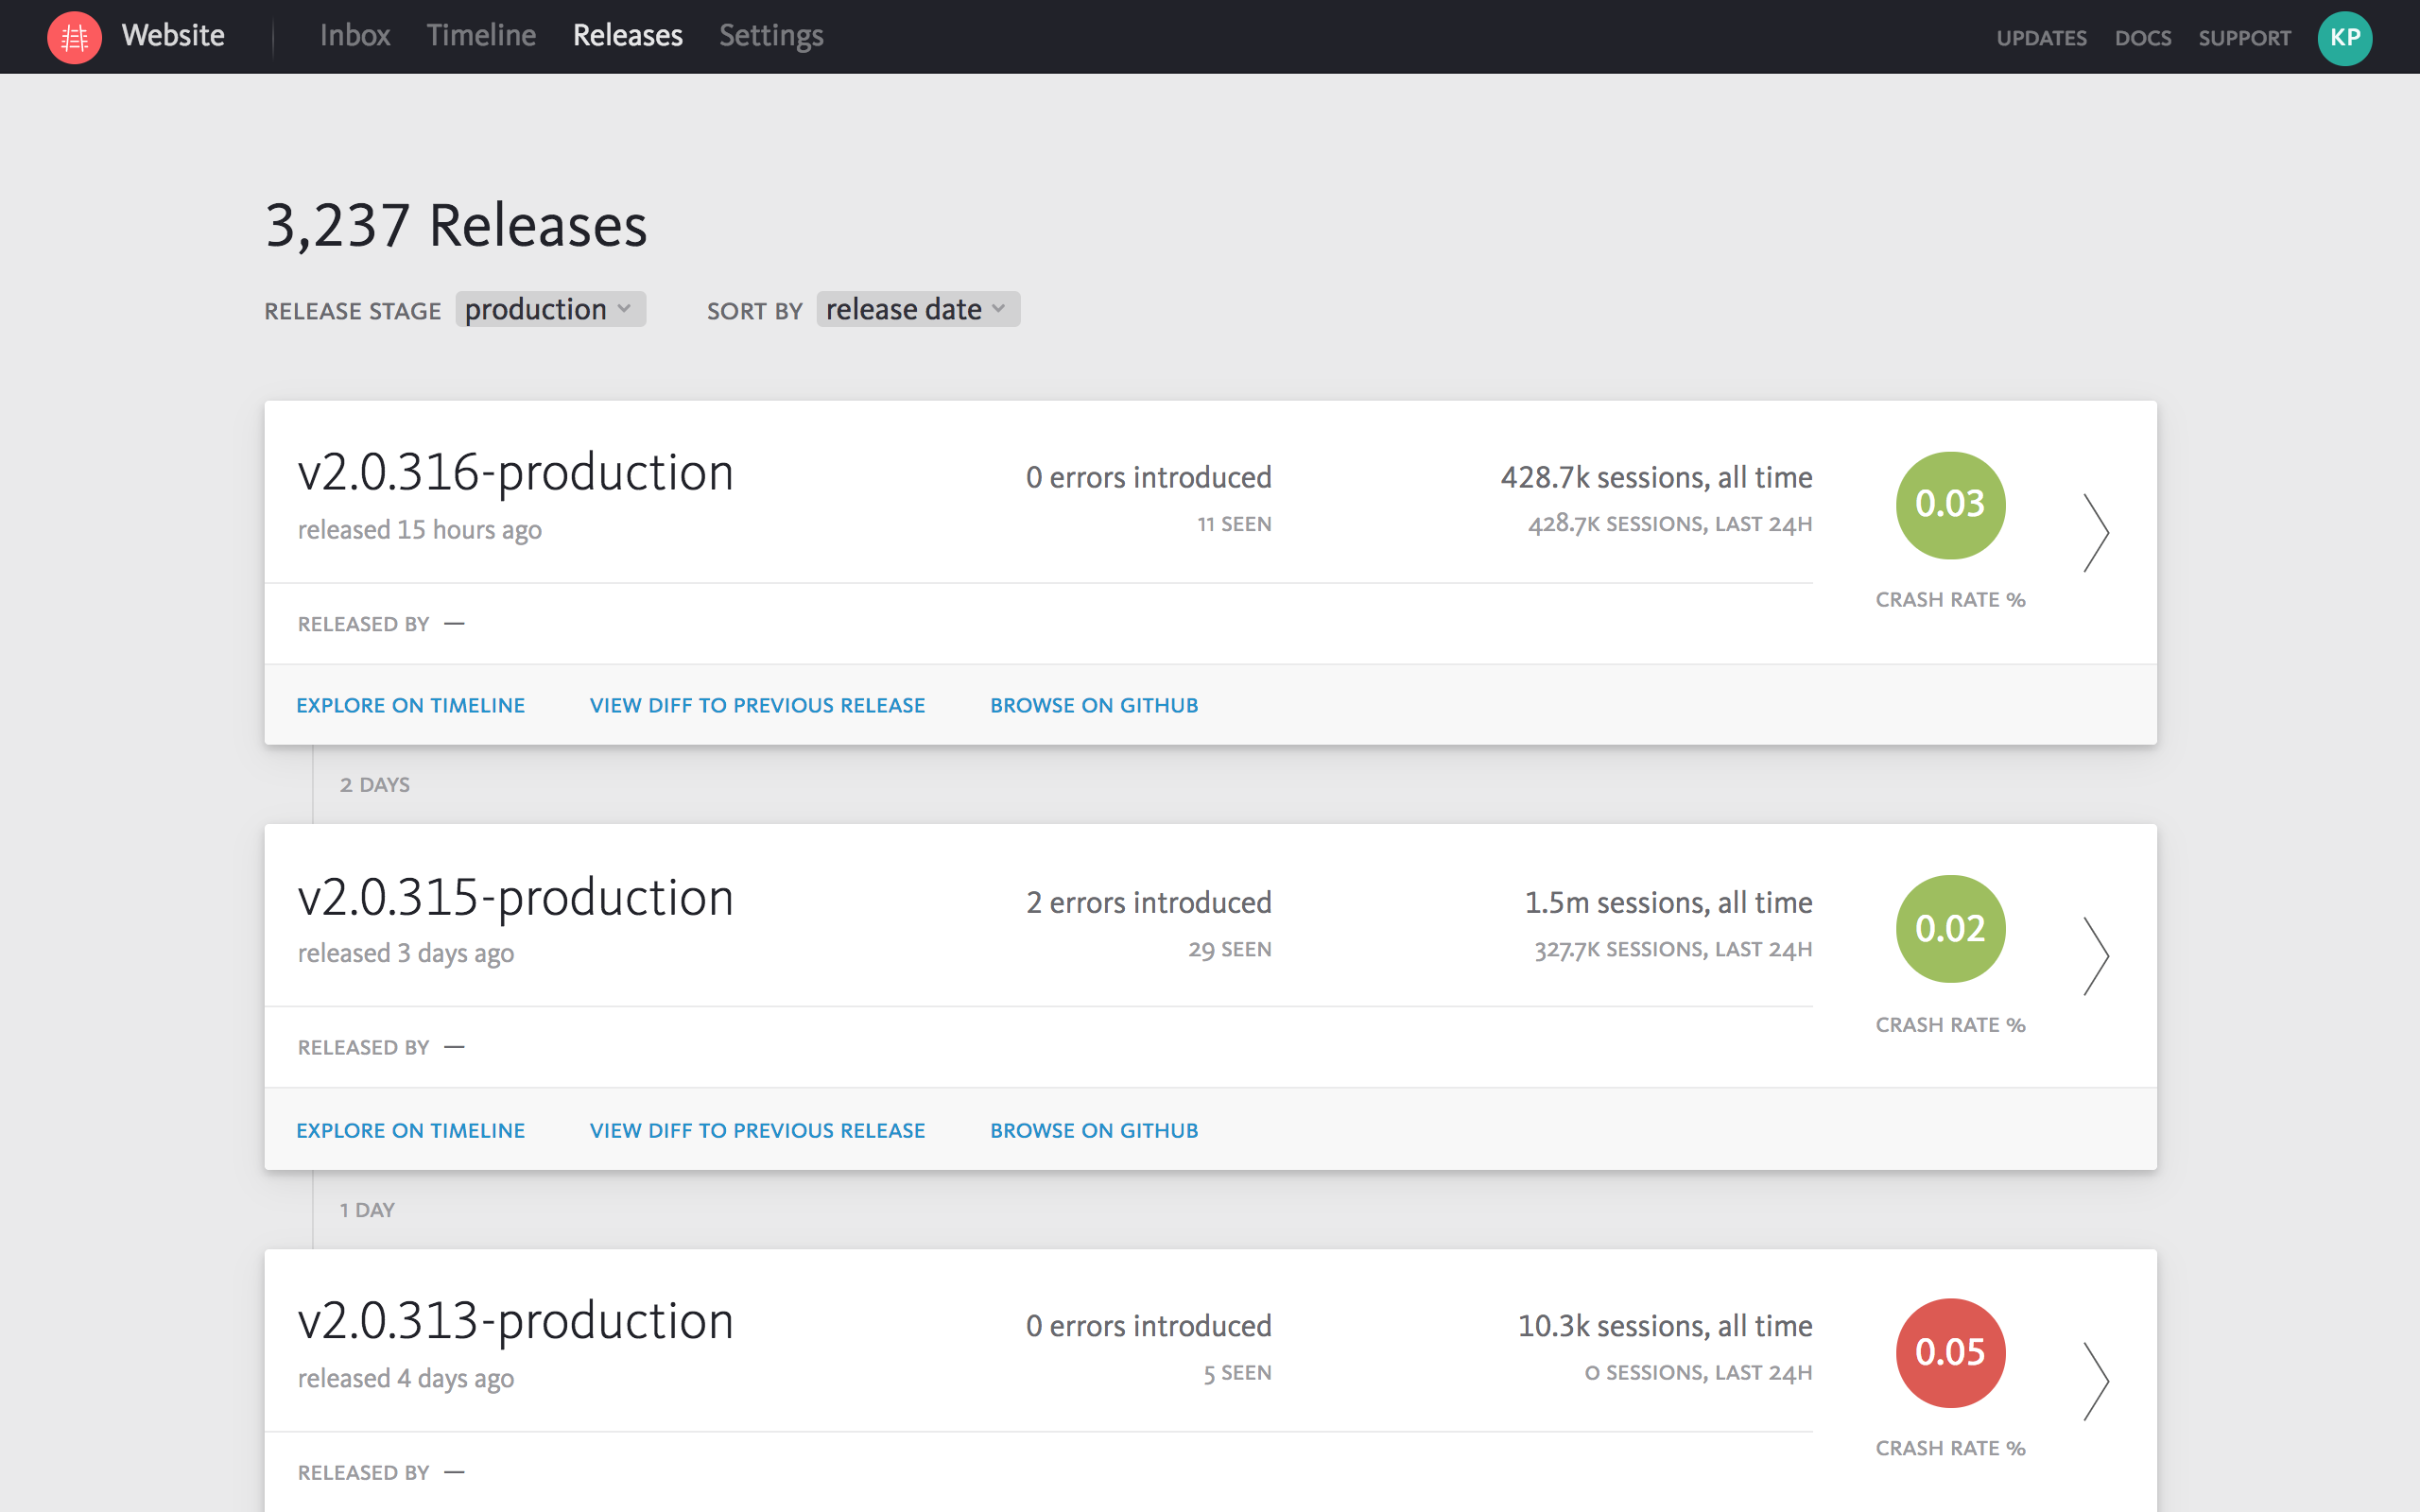
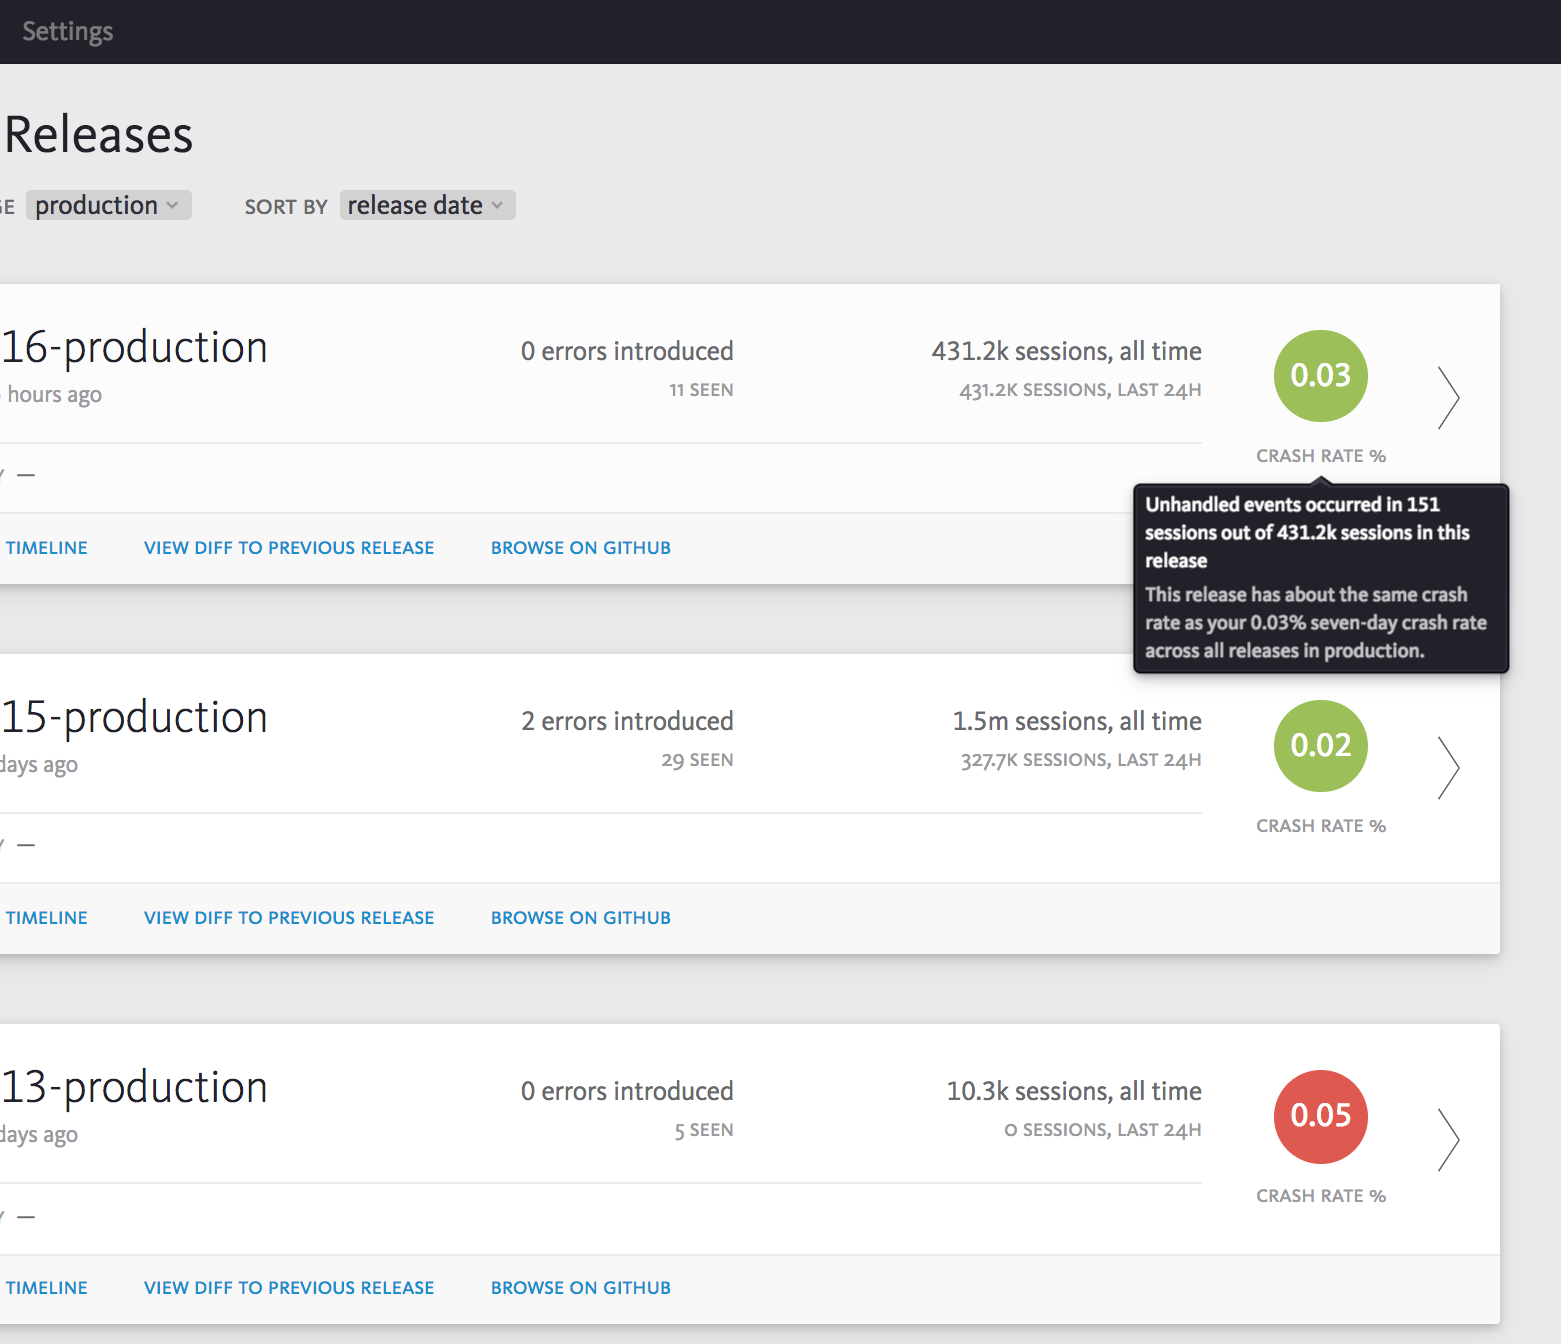
The Releases dashboard allows you to track the health of releases across all platforms, and includes a crash rate indicator (generated using sessions data) and errors grouped by release.
A definitive metric for release health
The crash rate indicator shows the percentage of sessions in a release that end in a crash. It is calculated using accurate crash rate and sessions data, giving you a definitive metric for release health. You can now choose to send sessions information to Bugsnag, and this information will unlock the crash rate indicator in your dashboard, showing the percentage of sessions that experience an unhandled error.
Using this metric, you can benchmark release health, allowing you to compare releases to each other and track improvements over time. Use the crash rate indicator to decide if your release is successful, or if your team needs to focus on debugging to improve its health.
Compare releases and improve release quality
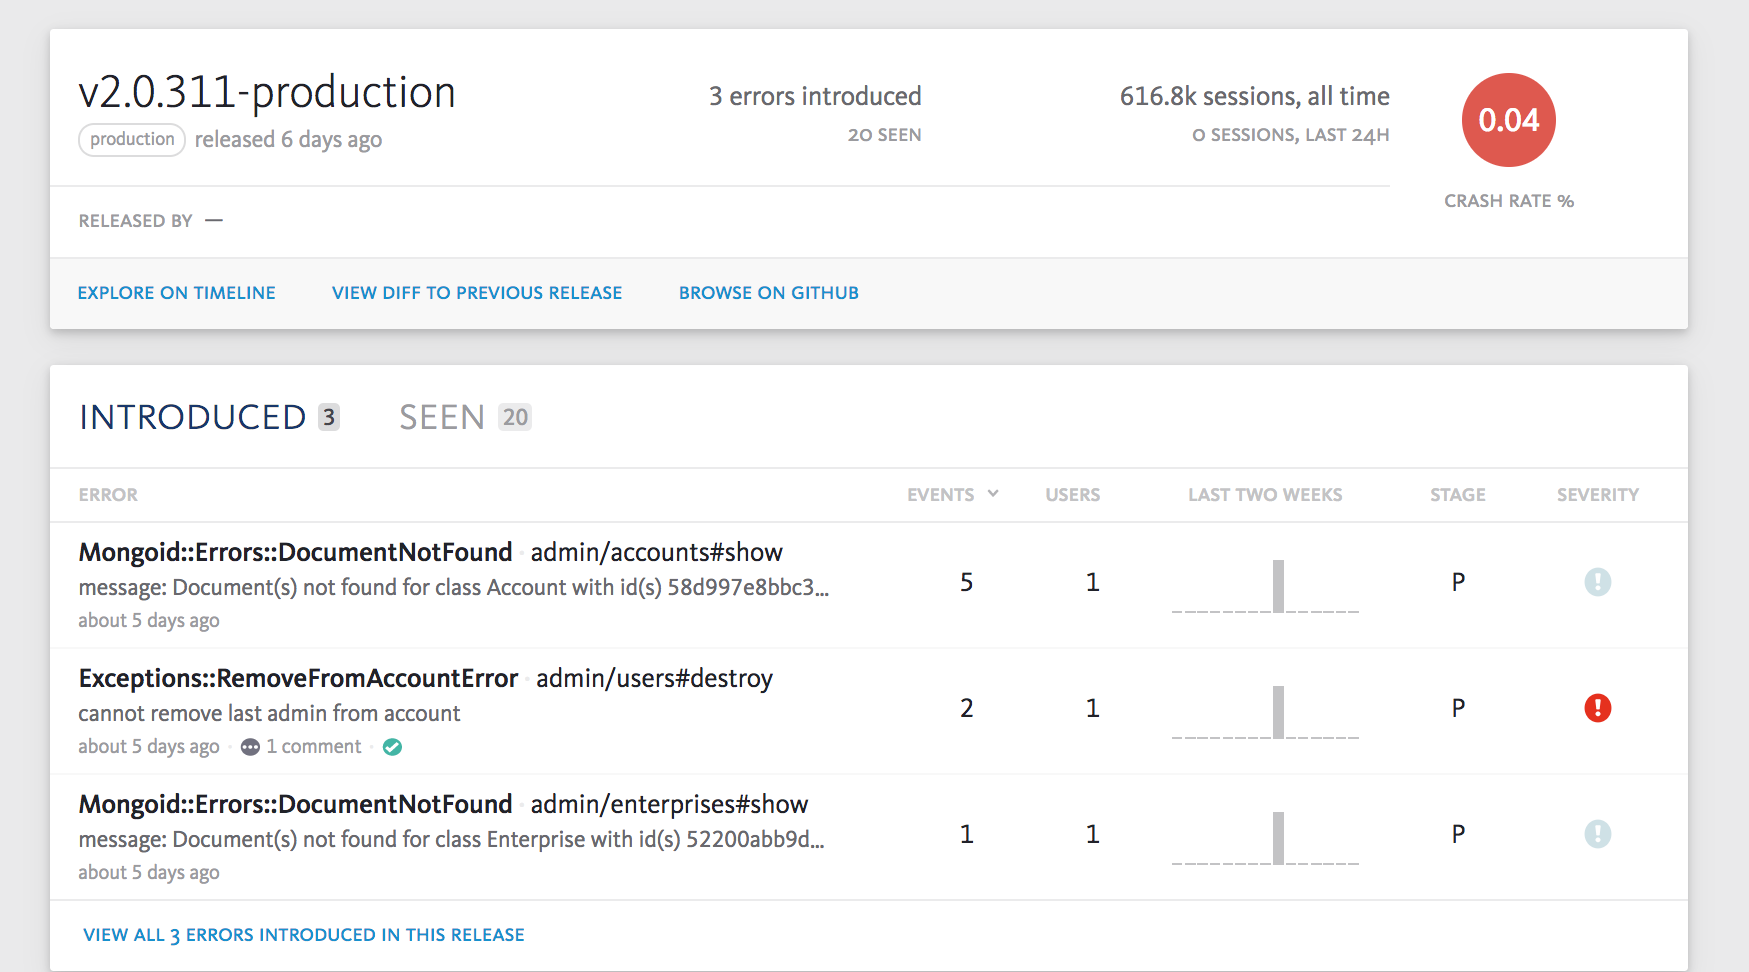
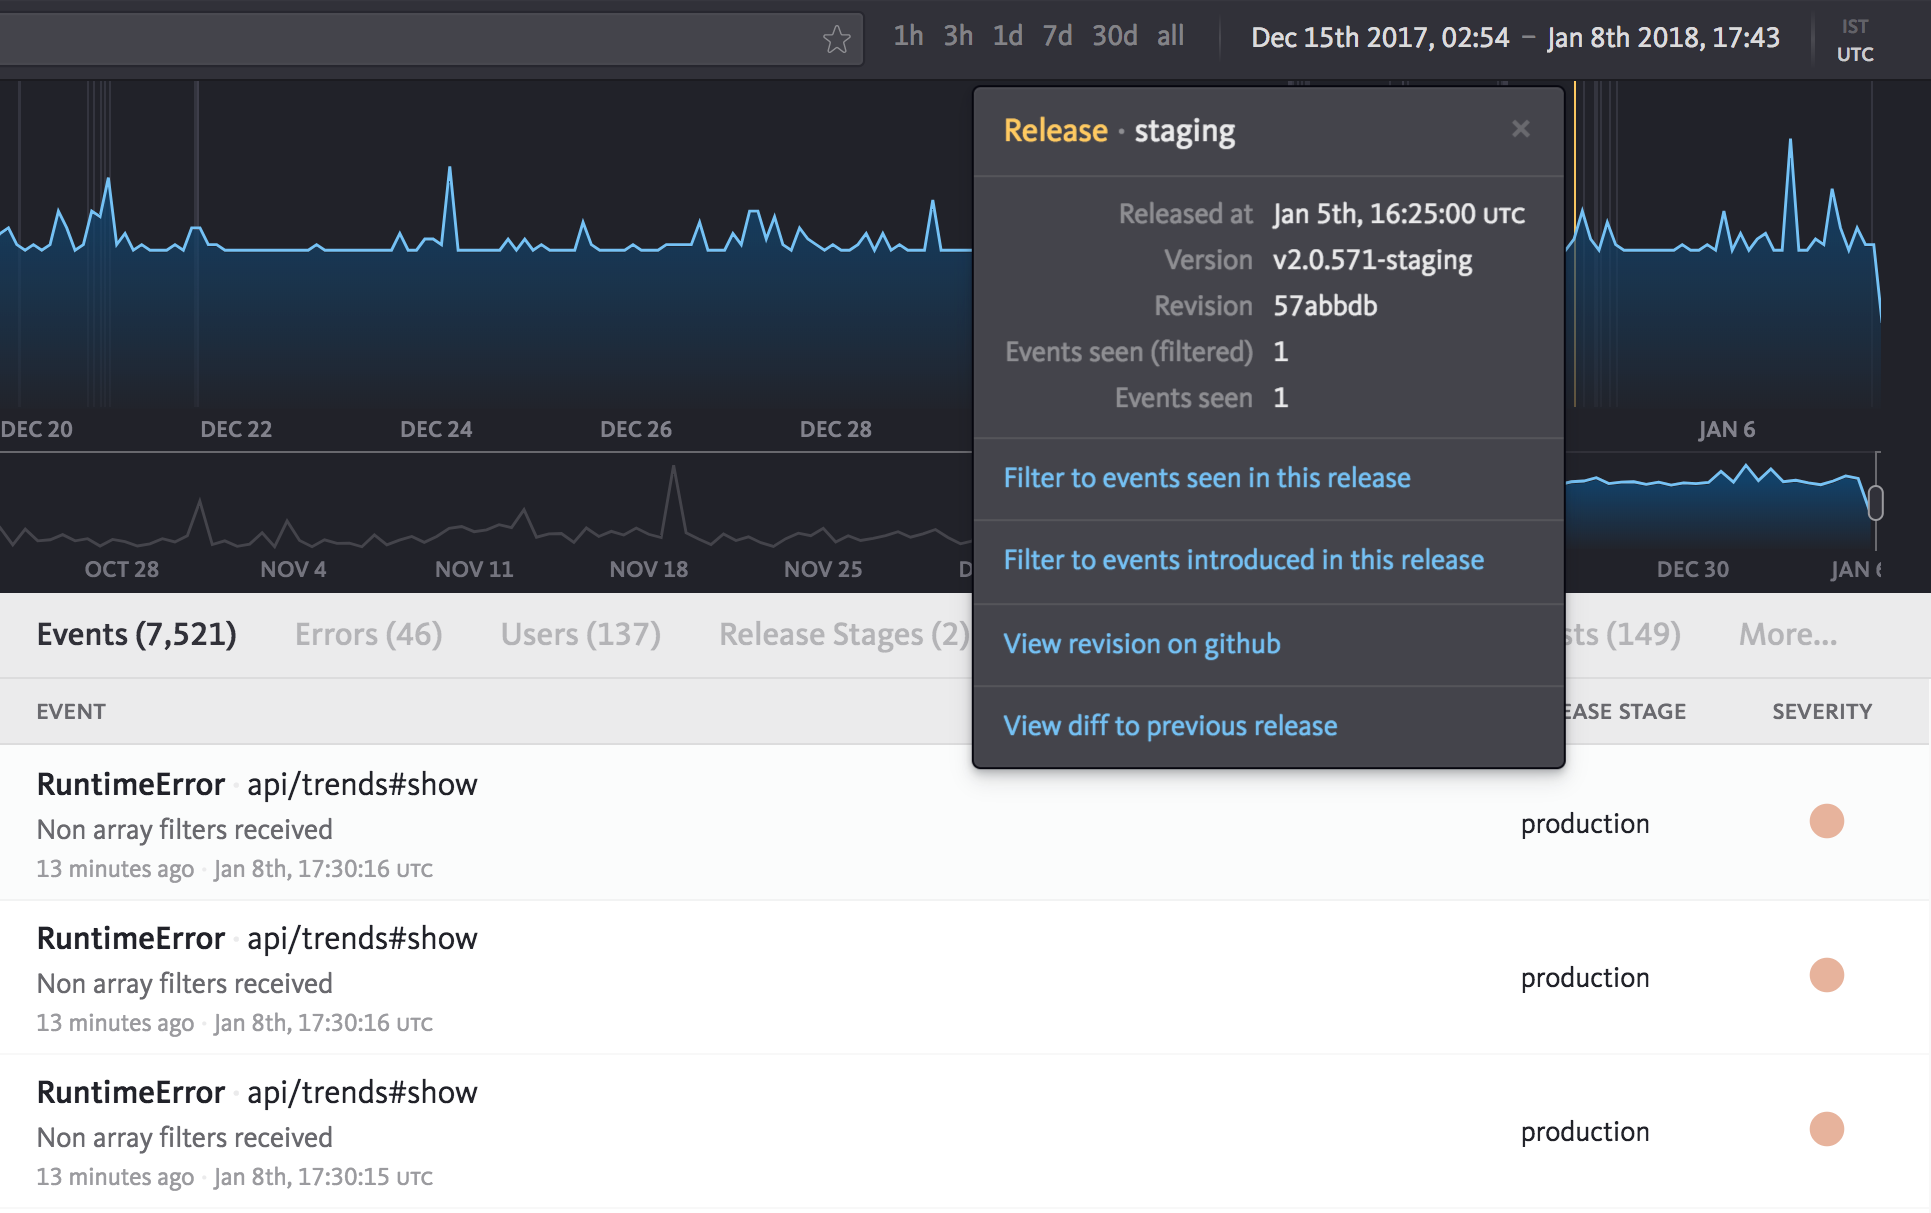
In this view, you can also see the errors in a specific release. This makes it easier to triage and prioritize errors in the versions of your application that matter most because of how widespread it is amongst your user base, or how new it is. You have the option to explore the errors from a specific release on the timeline where you can visually investigate spikes. Or, you can choose to view a diff to the previous release to understand the changes that might have introduced the new errors.
Easily view the source code used in a release
We’ll soon be releasing build tool integrations which you can use to notify Bugsnag when you build, release, or deploy your application, and include the source code used in the release and the person who made the build. These integrations will be available for major build tools across platforms.
The source control information will allow you to navigate directly to your code and view code diffs from the Releases dashboard, release annotations on the timeline, and from your stacktraces.
Getting started with the Releases dashboard
The Releases dashboard is available immediately for Bugsnag Pro users. To begin reporting sessions data and view the crash rate indicator, please upgrade your Bugsnag library to the latest version and enable session tracking. The updated libraries for Go and Java are coming soon.
Existing Free and Team Bugsnag users can try the Releases dashboard by starting a Pro plan trial in their dashboard.
Changes for existing Bugsnag users
Release annotations
We’ve expanded support for release annotations (previously deploy annotations) to all platforms. In addition to server-side applications, users monitoring mobile and client-side applications will now see annotations for each release graphed on the timeline view alongside errors. If you’ve configured versions in your notifier, these annotations will automatically be visible on the timeline.
Filters
With the introduction of releases, we’ve replaced version filters/pivots in Bugsnag with release filters/pivots. Here are the filters which have been deprecated:
- seen in version
- introduced in version
- seen in version code
- introduced in version code
- seen in deploy
- introduced in deploy
They’ve been replaced with simply seen in/introduced in release. You can find them as both filters and pivots in your dashboard.
———
The Releases dashboard is your new go-to tool for shipping new features confidently, while maintaining your team’s standards for quality software. You can try it out now in your Bugsnag dashboard or by starting a free, 14-day trial of Bugsnag Pro.
For more information, please visit our documentation.