
Introducing user stability analytics for mobile and web applications
We’re excited to share that you can now gain a comprehensive understanding of the experience users have with your application with our new user stability analytics. Until now, stability in Bugsnag was measured as the proportion of app sessions that are crash free. User stability adds to that and is a measure of the proportion of your application’s daily active users who do not experience a crash.
Along with providing this new metric, we’ve also taken the opportunity to improve the design of the Stability Center and Releases dashboard to present the information you need even more clearly. Let’s dive into what’s new and what insights you can draw from the new user stability analytics.
Gain complete visibility into application health and user experience
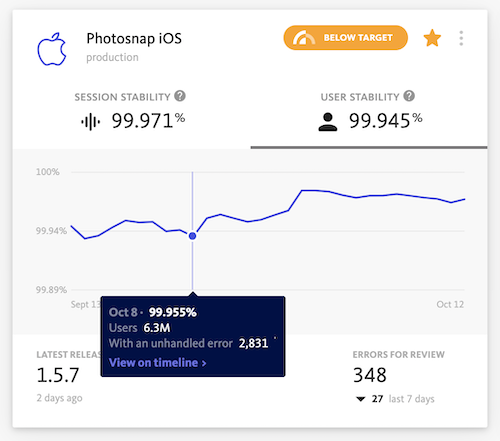
User stability analytics are now shown alongside the existing session stability analytics in the Stability Center and the Releases dashboard, providing complete visibility into application health and user experience. You can also find the DAU count right in Bugsnag when you hover over the user stability score, meaning you don’t have to turn to another dashboard for the metric.
While both types of stability analytics provide insights into application health, user-based stability can provide a more accurate picture of your application’s health in instances where a small number of users are experiencing a high volume of errors. For example, if a user is repeatedly launching your application on an unsupported mobile device (perhaps one that has been rooted, is outdated, or has the application installed in an unapproved way), and they experience a crash every time at launch, then your application’s session-based stability score may make it seem like the application is very unstable. In reality, the application is only unstable for this particular user — which you can now assess more accurately by seeing both session stability and user stability analytics side-by-side.
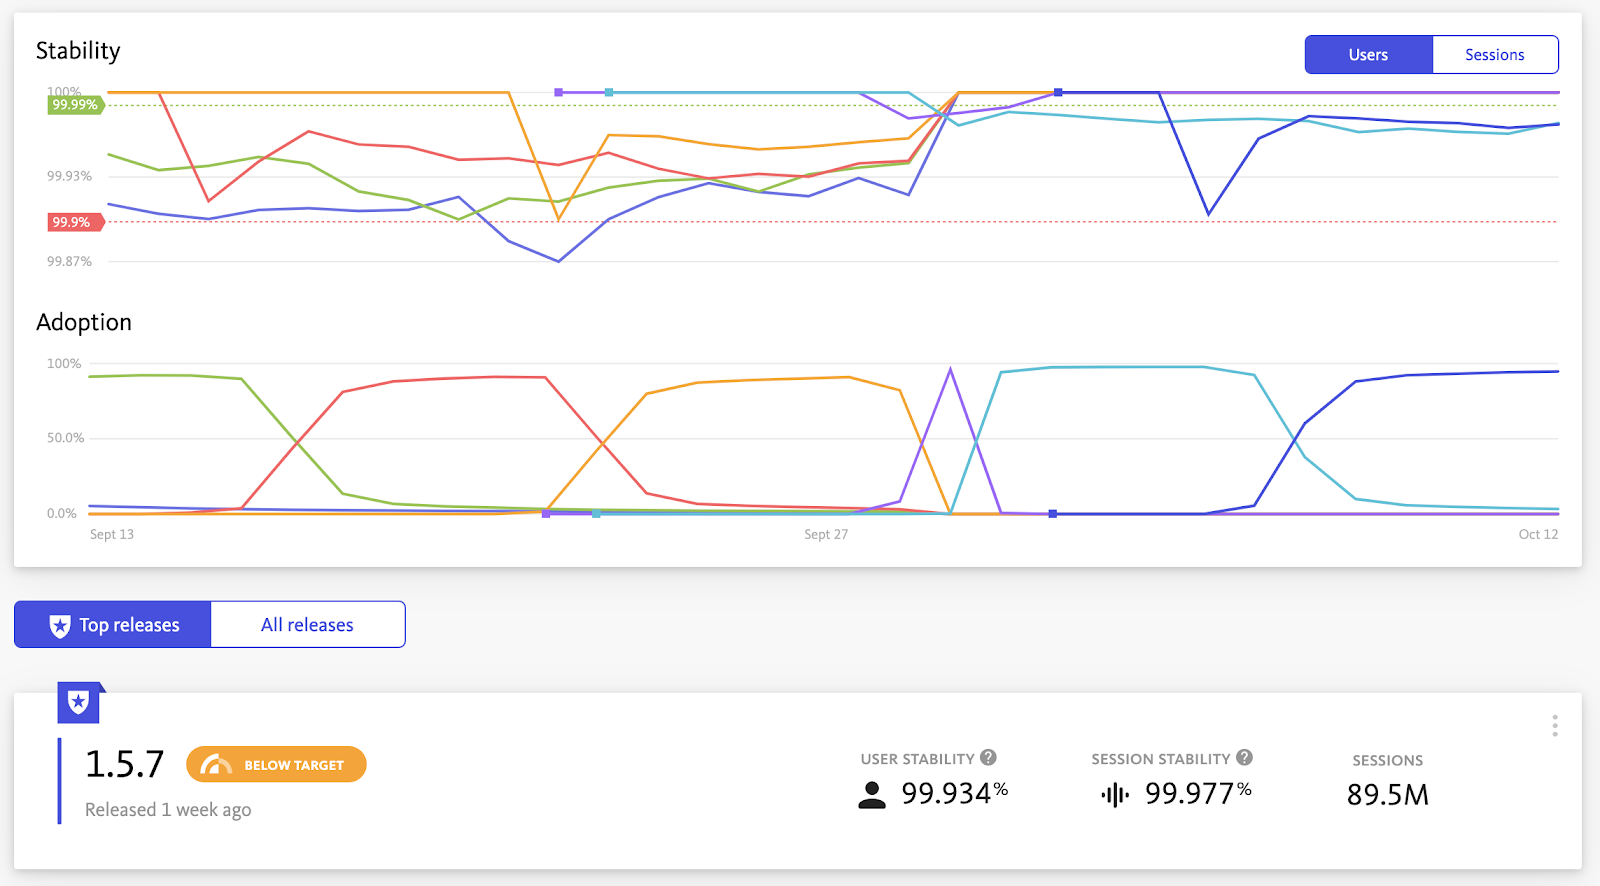
Simply toggle between session and user stability to see the corresponding trends graph in the Stability Center and understand trends in application stability over the past 30 days:
You can also toggle between session and user stability for the stability and adoption trends graphs in the Releases dashboard to understand how and why the stability of each release is changing, and compare it to the stability of previous releases:
Use stability targets to decide when to build features vs. fix bugs
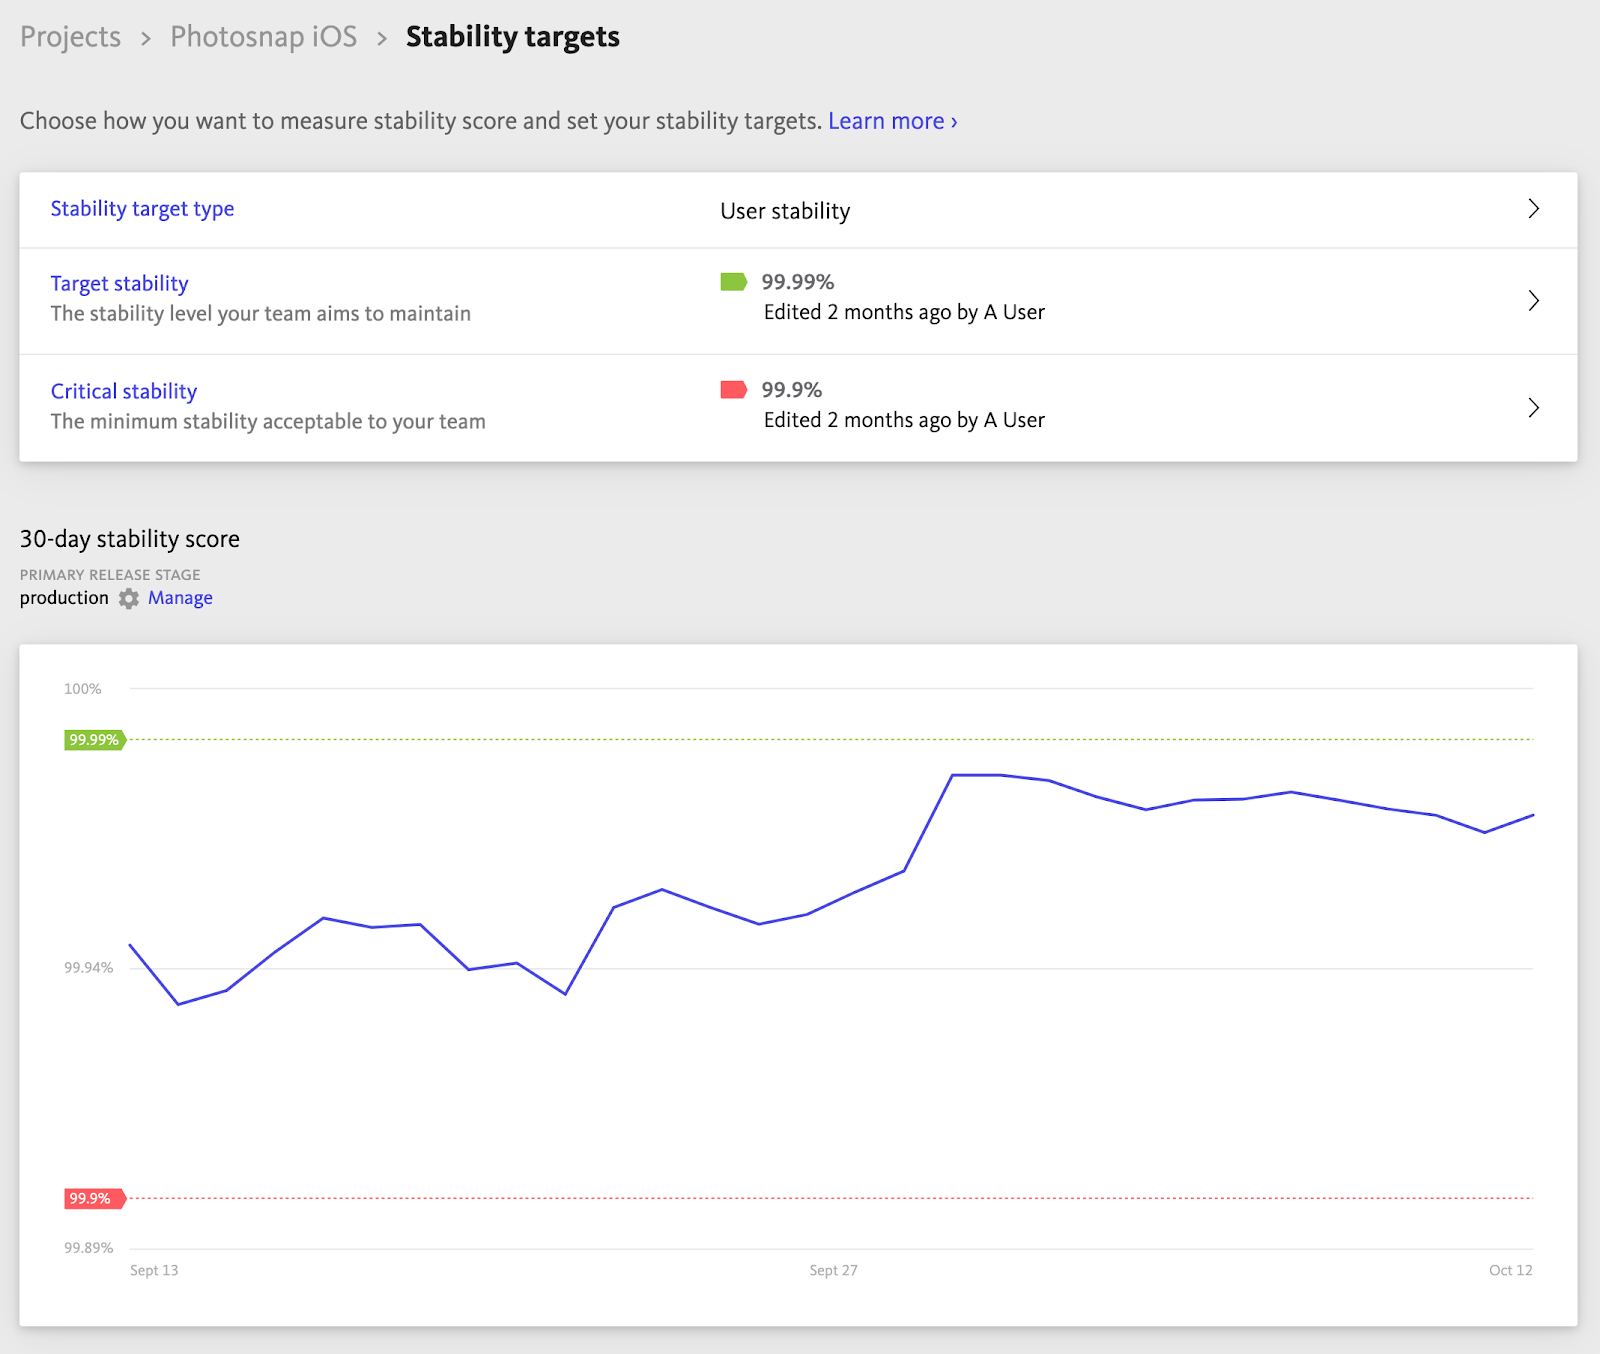
Stability targets in Bugsnag provide a way to set an application stability SLO and SLA:
- Critical stability is your SLA (Service Level Agreement) or the point where your whole team agrees that the product is on fire and needs attention immediately.
- Target stability is your SLO (Service Level Objective) or aspirational stability goal that many organizations communicate externally to set appropriate user expectations.
Now you can choose which type of stability you would like to use when setting targets — user or session stability — depending on how you are tracking other business metrics (more on that in a second). Once configured, stability target indicators will show at a glance whether the real-time stability score is above target stability, below target stability, or below critical stability.
Like session stability, you can compare real-time user stability scores against targets to align engineering and product teams and make data-driven decisions about when to build features vs. fix bugs. Generally if the stability is above target stability, you can focus on building new features but if the stability drops below target stability, you’ll want to balance bug fixing with new feature development to improve stability. We’ve discussed how to set and use stability targets in depth in this blog.
Understand how one KPI may be impacting others
Because user stability is indicative of customer experience — a low user stability means more of your customers are having a poor experience with your application — it is a very important KPI to monitor and improve. And now you can do that as well as see a holistic picture of how it may be impacting user engagement, retention, and business growth.
Correlate your application’s user stability with other user-based metrics you are already tracking, such as daily active users (DAU), average revenue per user (ARPU), conversion, churn, retention, and app store ratings among others, to draw deeper insights. For example, if you notice a lower user stability than normal and lower conversion then there may be an error that is preventing your customers from converting, perhaps one in the sign in or purchase flow. Or maybe you notice a lower user stability and higher churn, which can indicate that customers are turning to alternatives because they are having a less than stellar experience with the application.
Get started
User stability analytics are available in Bugsnag’s Standard and Enterprise plans for all client side project types including Android, iOS, React Native, Unity, and browser JavaScript apps.
If you’re not seeing user stability analytics, make sure you’ve upgraded your notifier library to the latest version.
Are you new to Bugsnag? Start a 14-day free trial, or request a customized demo of our error monitoring and stability management platform.