
Using the Chrome DevTools Everywhere: It’s not just for the browser
We’ve all experienced the awesome UI and powerful features of Chrome Developer Tools. They’re a dream for web developers, making it easy to dive deep into your applications, right within your browser console.
With such incredible benefits, could we possibly use this tool for applications that live outside of the browser?
The answer is yes! Thanks to many inventive developers, the Chrome Developer Tools can be configured to help analyze, manipulate, and debug apps that exist outside the browser. How cool is that?
Here are 5 things you might not know you can do with Chrome DevTools:
Debugging Native iOS Applications
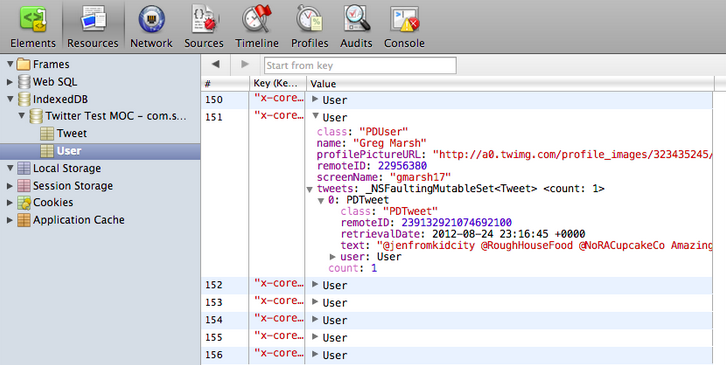
With the magic of PonyDebugger, you can debug network traffic and data stores in native iOS apps. It’s possible thanks to the mobile team at Square who wanted to take advantage of the awesome debugging tools available to web developers. You can read more about how it works here.
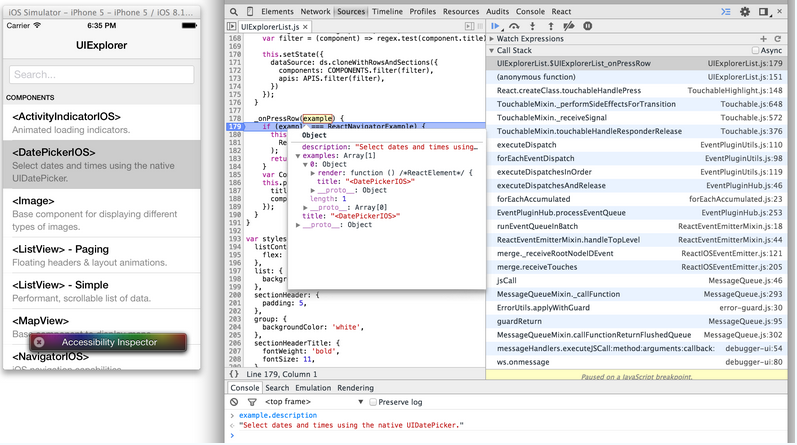
You can also debug your iOS applications written in React Native using DevTools. Facebook has built this integration right into the framework, so you can get setup really easily.
Debugging Native Android Applications
Stetho lets you debug native Android applications using the Developer Tools interface. Built by Facebook, Stetho allows for easier, more convenient debugging. You can see details on installing it here.
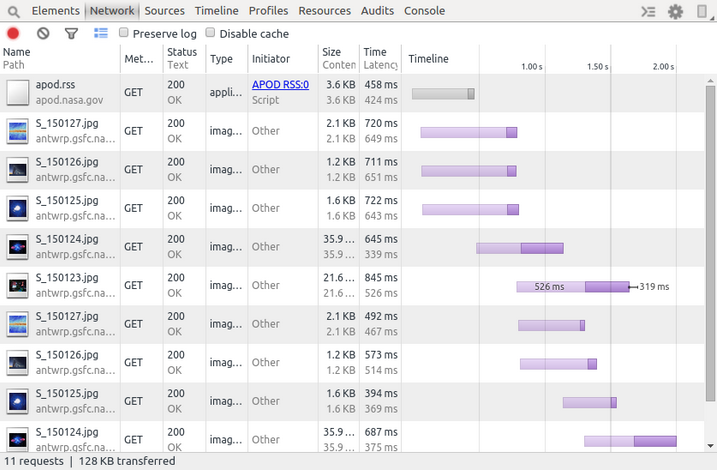
Remote Debugging Chrome on Android
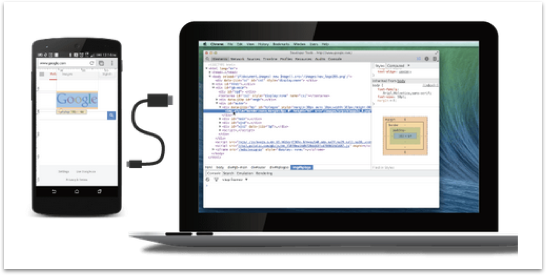
You can also use the desktop Chrome inspector to remotely debug mobile Chrome web performance. It also lets you debug WebViews on native Android apps! This is actually built right into it’s functionality so you can easily hookup your Android device to your computer to use the awesome Developer Tools.
Debugging Node.js
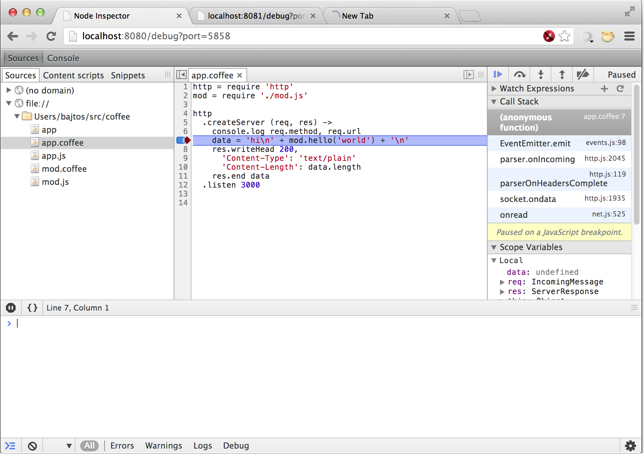
Another popular way to use the browser console is with Node.js. With Node-inspector, you can connect your Node.js applications to the browser tools for more convenient debugging.
Debugging Ruby and Rails Apps
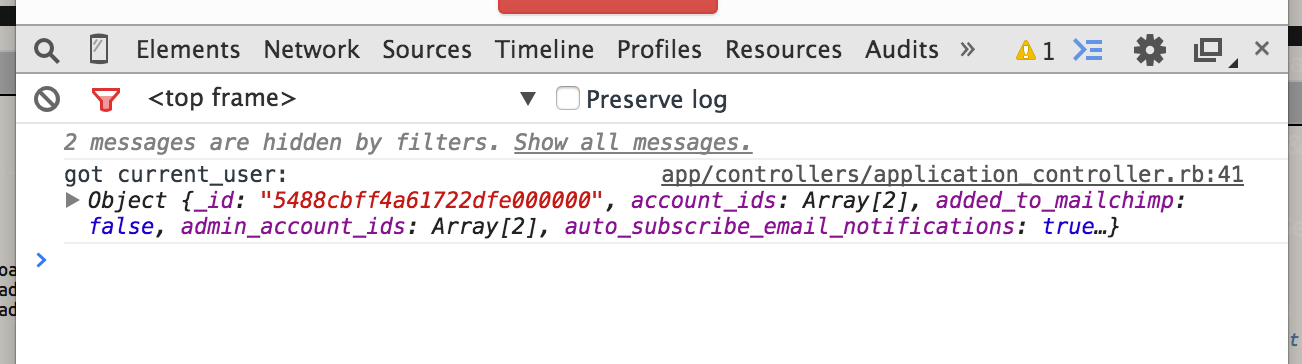
Another cool way to use the Chrome Console is with console.log from Ruby (not to be confused with JavaScript’s). Built by our own Conrad Irwin, this tool lets you log to the Chrome Console from your Ruby and Rails applications. Debugging Ruby apps has never been so delightful!
Debugging Other Server Side Apps

Last but not least, Chrome Logger does it all, allowing you to easily debug your server side apps in all programming languages. It’s been helped along by the open source community, and you can find the full list of server side libraries here.
———
These tools are perfect examples of just how powerful the Chrome DevTools are for interacting with your applications. The convenient UI makes it easy to access important parts of your application—even the ones that don’t live in the browser.
For those that do, you should try Bugsnag’s JavaScript error monitoring!
Have you come across any other cool uses for the Chrome Developer Tools? Let us know on Twitter!