
App Stability Series: Gain Precision and Reduce Noise with BugSnag Best Practices
This blog is derived from the App Stability Series webinar, “Unlocking BugSnag’s Power Features,” a series focused on showcasing BugSnag’s most powerful features that deliver an effective app stability experience.
As digital transformation accelerates across verticals and consumers continue to adopt more applications into daily life, the engineering organizations behind these applications need to scale their teams, infrastructure and processes accordingly. Demand for new and improved functionality pushes for shorter development cycles and drives the adoption of progressive delivery practices. Traffic and data volumes continuously increase and apps integrate with more third-party services, increasing interdependency. All of this puts a strain on the ability to efficiently monitor app health and stability, as well as identify root causes of bugs.
There is quite a bit of flexibility within BugSnag that can sometimes go unnoticed by our users. Although BugSnag’s main functionality can be stood up in a matter of minutes by adding our SDK to your application, we do have a lot of features to address problems at scale and have collected some smart solutions from working with our power users. Some of these best practices are laid out below for your teams to leverage.
Not all bugs are created equal
Some bugs prevent users from being able to complete critical functions or revenue-generating activity. Some crashes can quickly be isolated from users if they are known to be specific to a release version or a feature toggle. Other functional problems, like ANRs, app hangs and out of memory exceptions (OOMs) could be coming from outside of your code itself.
Some of the visibility and monitoring challenges we often hear from engineering teams, of every size and across all verticals, are:
- Isolating incidents: Taking the live stream of exceptions and honing in on specific situations, like crashes in specific critical paths & user bases, crashes related to live ops issues like third party outages, or A/B tests going wrong.
- Sifting through noise: Utilizing engineering resources to manually triage incoming errors or investigate issues that turn out not to be priorities. This includes errors coming from low-end devices, bot traffic and browser extensions.
- Correlating errors with specific releases or feature toggles: Additional complexity is introduced when features are shipped more frequently. Further manual work is introduced in trying to correlate errors and find causation across many app versions and active experiments or feature flags.
How BugSnag can be configured to protect revenue and reduce noise
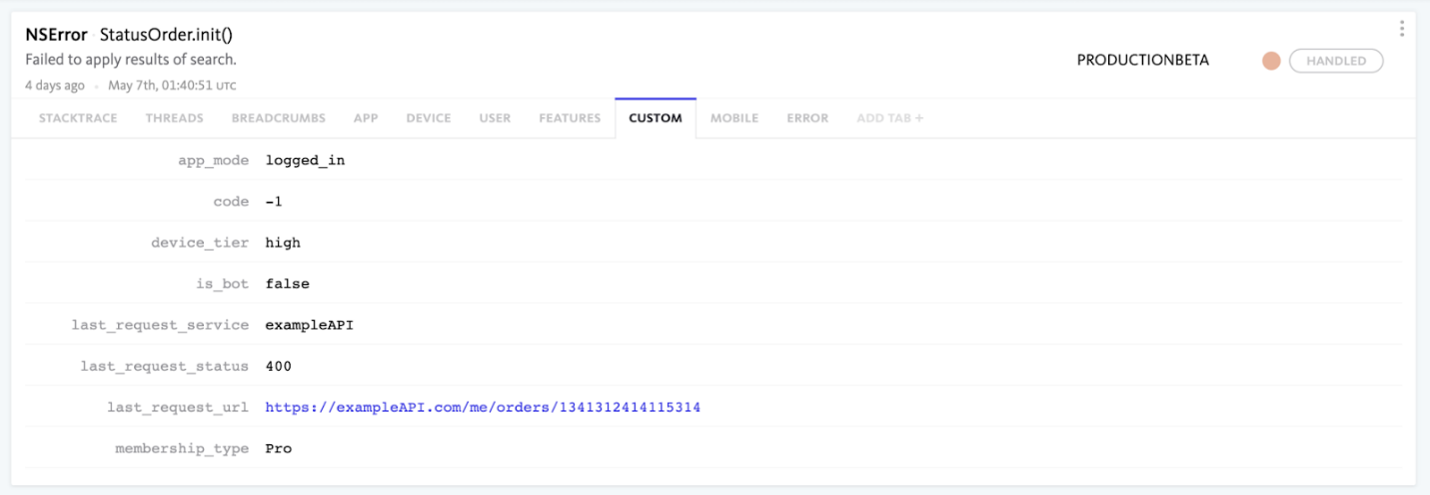
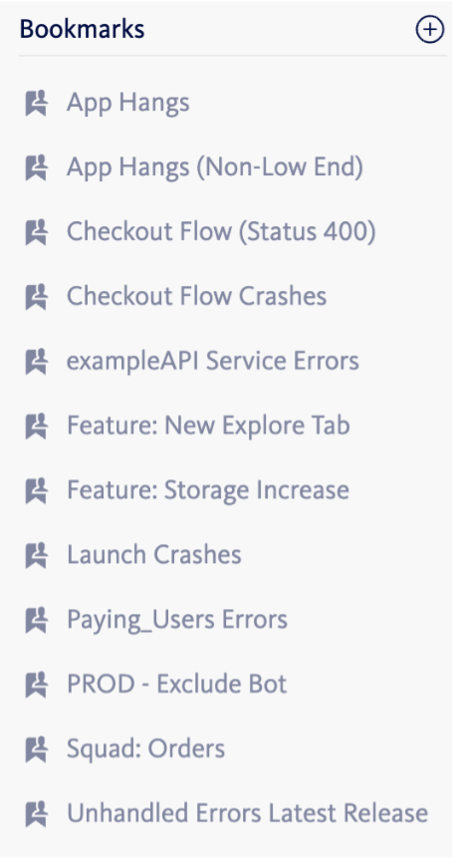
In order to provide a richer context for your errors, custom metadata may be added. This is incredibly helpful in tracking additional business or industry specific attributes and allowing for this information to be searched against within your errors. Custom metadata opens a range of possibilities, especially since bookmarks allow you to save searches in your team’s inbox, track trends and automate alerting or ticket creation to specific error segments. Some relevant metadata concepts BugSnag users leverage today are listed below.
Key Metadata Concepts:
Customer Tier/ Type: From eCommerce apps with loyalty or membership programs to gaming apps where users accumulate a lifetime spend, logging the customer’s loyalty status to your app is a crucial way to segment and track the experiences of your most important user bases.
- We recommend segmenting out errors in production where the user is of high value – this way custom notifications can be leveraged to notify your customer success organization if there are spikes in errors in this segment. This gives the team the ability to proactively respond to any highly valued users who run into significant issues with your application.
Device tier: Understanding if an ANR, app hang or OOM error is coming from a performance issue in the application or from the user’s device can be a very valuable distinction to reduce noise and properly prioritize. Some BugSnag users maintain an internal mapping of device manufacturer or name to a classification (i.e., low, medium, high), and add this as metadata.
- If you monitor ANRs, OOMs or app hangs in your app, we recommend implementing a similar mapping and adding device tier metadata, so that all bookmarks tracking these errors can specifically exclude any exceptions coming from low-end devices.
isLaunching: By default, BugSnag provides metadata in Android, iOS, React Native, Unity and Unreal that identifies if the app was launching during the time of the exception. The point at which your app is considered “launched” is configurable and can be either time-based or declared manually (see the “Identifying Crashes at Launch” section of our documentation).
- We recommend creating a “Launch Crashes” bookmark where the parameter isLaunching = true, as this will allow you to track trends in launch crashes.
- I also recommend taking a look at a webinar led by Ivan Diaz, which includes a live demo on detecting and remediating crash loops from within your app code.
Third Party Requests: Network request information can be an important indicator when monitoring errors. Information like the last requested service, last request status and last response duration are powerful metadata to track. This can provide insights for gaming applications connecting with ad networks, or for general live ops issues, such as detecting spikes in errors potentially caused by payment or other third-party service outages.
- In iOS/Android applications, we recommend leveraging a callback function to check the event’s breadcrumb data for any network requests, and attaching the most recent network request details as custom metadata. Network breadcrumbs must be enabled in order to implement this approach.
- With this metadata added, it’s possible to filter for errors where the last request was to a specific service or ad network, or to segment errors where the last request status was not 200, in order to assist in identifying correlations.
Bot Traffic: Within web applications, bot traffic will likely be prevalent and might even trigger errors that end up in your BugSnag inbox. Given that these events aren’t impacting a true user’s experience and most bot traffic identifies itself in the agent string, some BugSnag users check for bot traffic and add metadata to flag if a session is from a bot. This way, any exceptions linked to bot traffic can be excluded as part of your search parameters.
These concepts outline just some of the ways in which custom metadata allows you to track more precise segments of errors, and how to leverage them to both isolate visibility around revenue and ops situations, as well as to reduce noise.
Focus in on stability of releases and feature flags
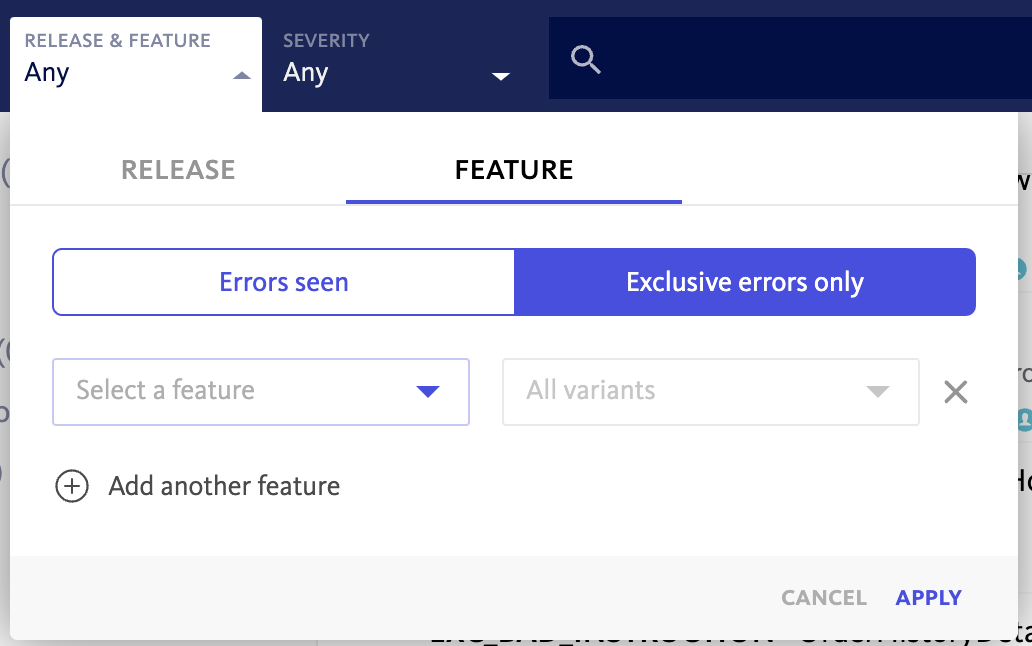
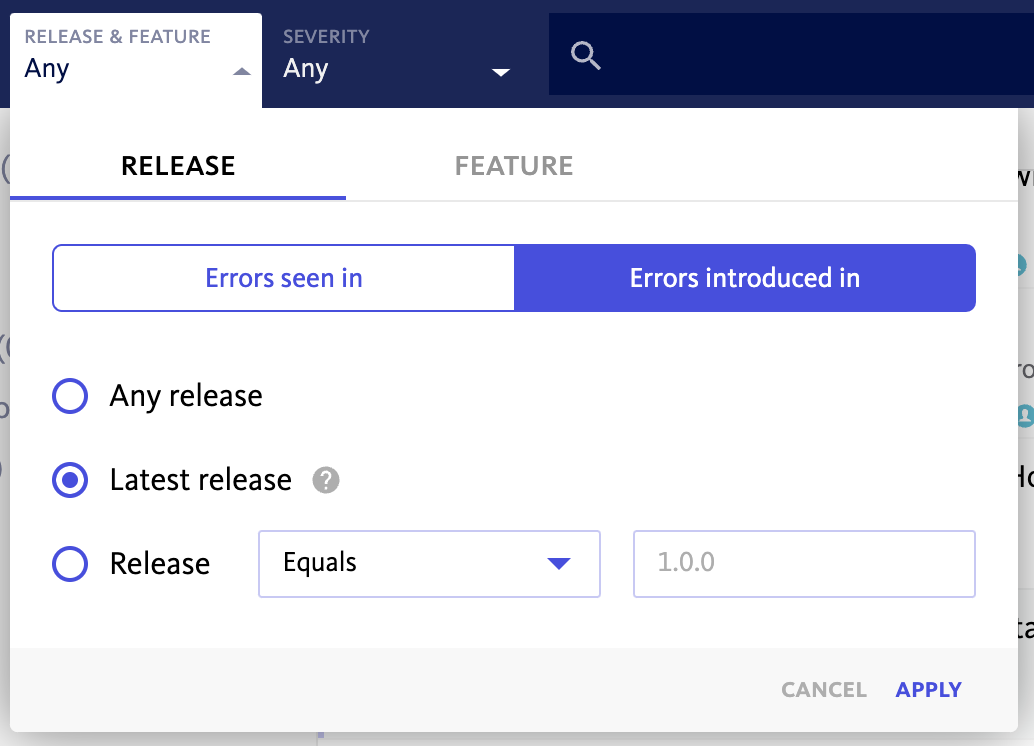
One of our newest additions to BugSnag is the Features dashboard, which provides actionable insights into stability of feature rollouts. One of the key functions within the Features dashboard is the Errors Introduced section, which highlights any errors that are exclusive to a specific feature flag or experiment. Our Releases dashboard also provides a similar Errors Introduced section, allowing developers to understand if there are errors unseen in any other version.
The Features and Releases dashboards allow developers to quickly understand if a release version or feature needs to be rolled back to preserve stability, and if code within a feature or release is causing specific exceptions. Many BugSnag users aren’t aware that the search builder allows you to filter the inbox for errors exclusive to a certain release version or feature flag.
- We recommend creating a bookmark for errors introduced in the latest version and linking this to alerting, so that your team is notified of new errors brought on by your latest release. This can also be done for new features being rolled out to your user base.
Our Releases dashboard typically becomes the command center for mobile teams and release managers in the days after their latest release, as this view provides the ability to monitor both stability and adoption by version number in real time.
- This dashboard can begin to hold quite a bit of data for web applications, that sometimes deploy hundreds of times per day.
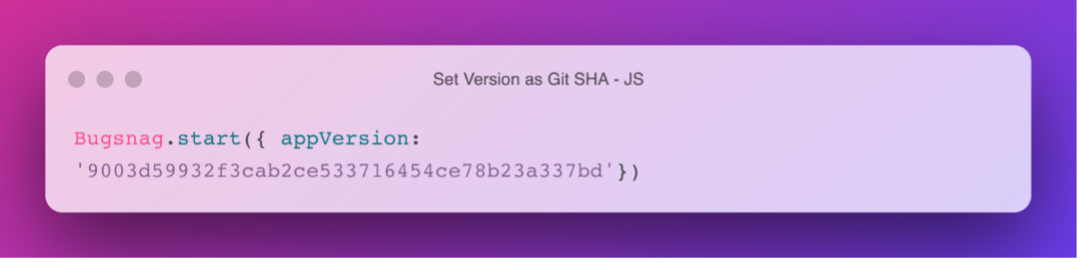
- For web applications, we recommend that version is set manually, in order to plug in a more easily identifiable naming convention such as the Git SHA, or even a unique identifier based on the timestamp of the release.
- Some of our major eCommerce BugSnag web users leverage this best practice to get stability by version as well as identify exclusive errors to specific versions.
Callback functions let you customize error data
For most platforms and error types, valuable information can be accessed and changed via callback functions, which gives you access to the error data before the event is sent to BugSnag. This helps teams do things like customize error grouping logic, add and change metadata or context based on breadcrumb properties, and even add additional information to tricky errors such as OOM errors in iOS. Information on callback functions for your platform can generally be found under the “Customizing error reports” section of our documentation.
In addition to implementing many of the metadata ideas mentioned earlier within a callback, some powerful examples of leveraging callback functions are below:
- Determine responsible team: Some BugSnag users pull error information to determine the team responsible for an error. They are then able to add the responsible team’s name as custom metadata to simplify filtering errors by relevant squad in the dashboard. This logic can range from checking characteristics of the stackframe URL in web projects to pulling the module out of the path in iOS/Android.
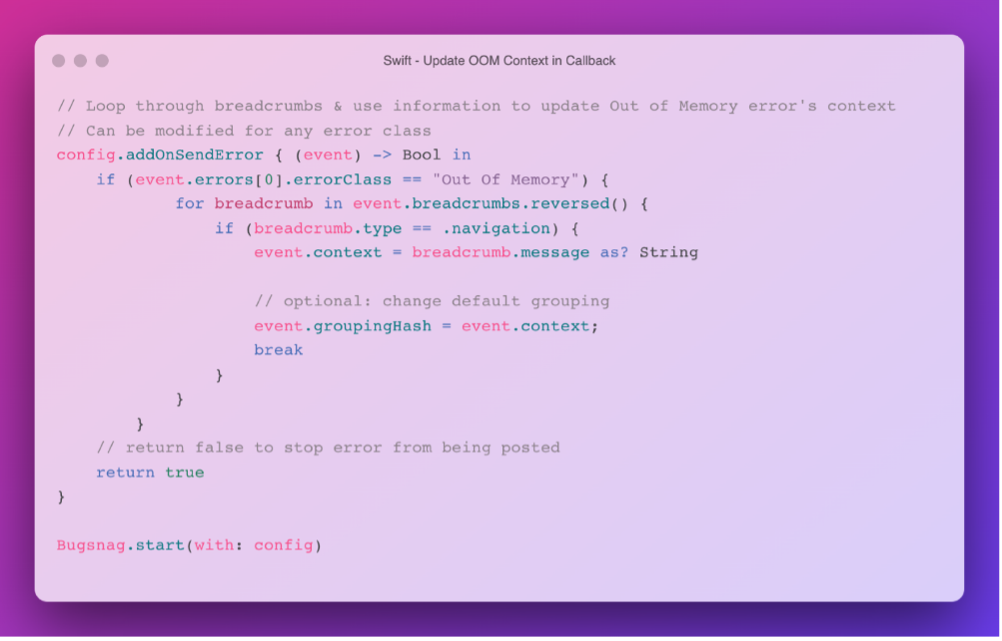
- Setting Context and Custom Grouping: We’ve worked with iOS teams on pulling the last navigated-to page or view in a callback, in order to add more context on where in the app users are experiencing OOM errors. BugSnag provides crucial information for OOM exceptions like breadcrumbs and metadata, and this can be leveraged to display the context of the OOM, as well as to group errors more precisely, so that you can track trends in OOMs in views or modules individually. In the example below, the callback function checks for relevant information in the breadcrumbs and uses this to change the OOM’s context and grouping hash.
Other configuration best practices
We’ve shared a lot of valuable examples of how to set up and customize BugSnag to gain additional insight. Some configuration best practices we generally recommend to our users are below that can be simple to implement yet yield powerful results.
- Max Breadcrumb limit: By default, BugSnag stores up to 50 breadcrumbs for each error, meaning that any additional user actions, device changes or network requests that are collected may start to drop off after the limit. Within the configuration, most platforms offer the option to adjust this to a true maximum of 100. If you are running into this limit in the dashboard, we recommend adjusting this maximum as needed in your code.
- Allowed Domains: For web applications, another important way to reduce noise is by configuring allowed domains. BugSnag enables you to add your domain to a list of allowed domains in our settings, so you can automatically ignore any JavaScript errors that happen on other domains. This way, your dashboard can focus solely on the errors you know are coming from your own code and exclude any browser extensions or debugging scripts. We recommend setting this for web customers, and more details can be found in our documentation.
- Setting Max Milliseconds Parameter for App Hangs: An app hang (iOS) occurs when an instance of the main thread fails to respond in some amount of time – this can occur when performing CPU intensive work or performing blocking I/O on the main thread. If your app hangs for 10 seconds or longer, it may be terminated by the system watchdog, which is considered a fatal app hang. If your iOS team would like to also report non-fatal app hangs to BugSnag as well, we recommend setting appHangThresholdMillis in the configuration to a value such as 5000ms. This allows you to gain visibility into performance issues that are not necessarily causing fatal crashes.