
Filtering in the all new Bugsnag: Tips for surfacing relevant error data
One of the most powerful features introduced in the new Bugsnag is the Filter Bar. We built it to help you better find specific subsets of error data by unlocking the ability to sort by and combine key/value pairs and time filters. The Filter Bar exists across Bugsnag, and because of its flexibility, you can find the exact information you need to answer questions about where and why your errors have occurred.
How to use the Filter Bar
There are two main dimensions of the Filter Bar – key/value pairs and time filters. By combining key/value pairs with specific time ranges, you’re able to filter the error data in your Dashboard down to the exact subset you need to debug quickly.
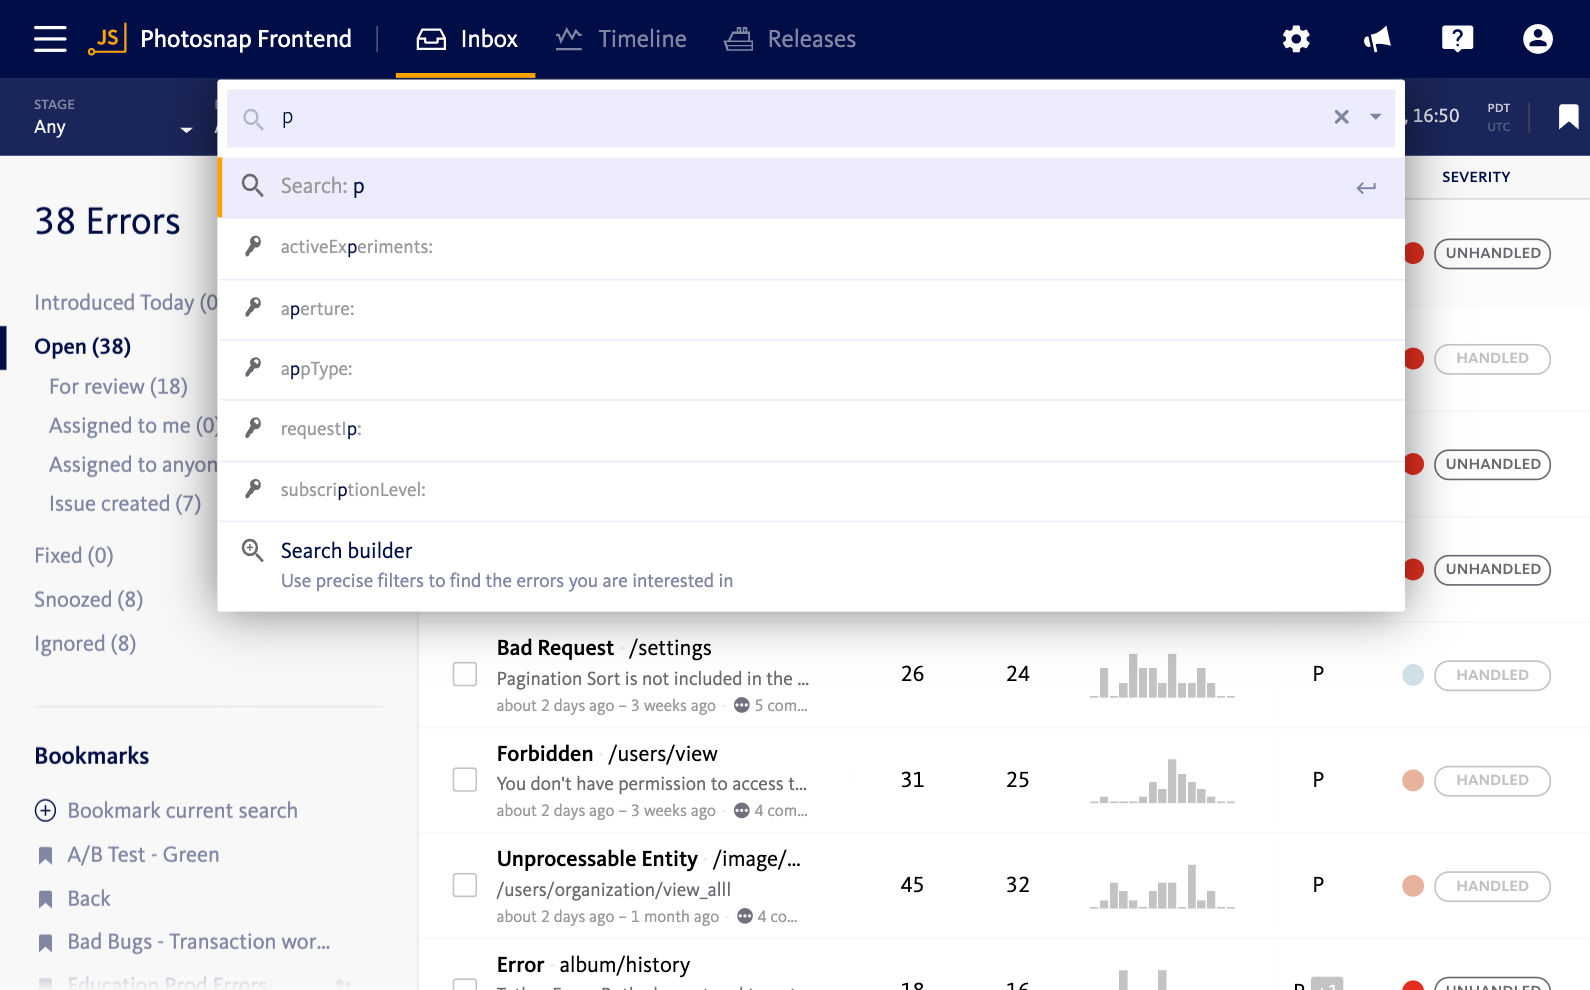
To get started, click on the filter bar, and select the filter key you’re looking for from the dropdown menu. Once the key is in place, you can then type in the value you want to surface data on. For example, you might select the release stage filter key, and then type in production, which will surface only production errors for your project.
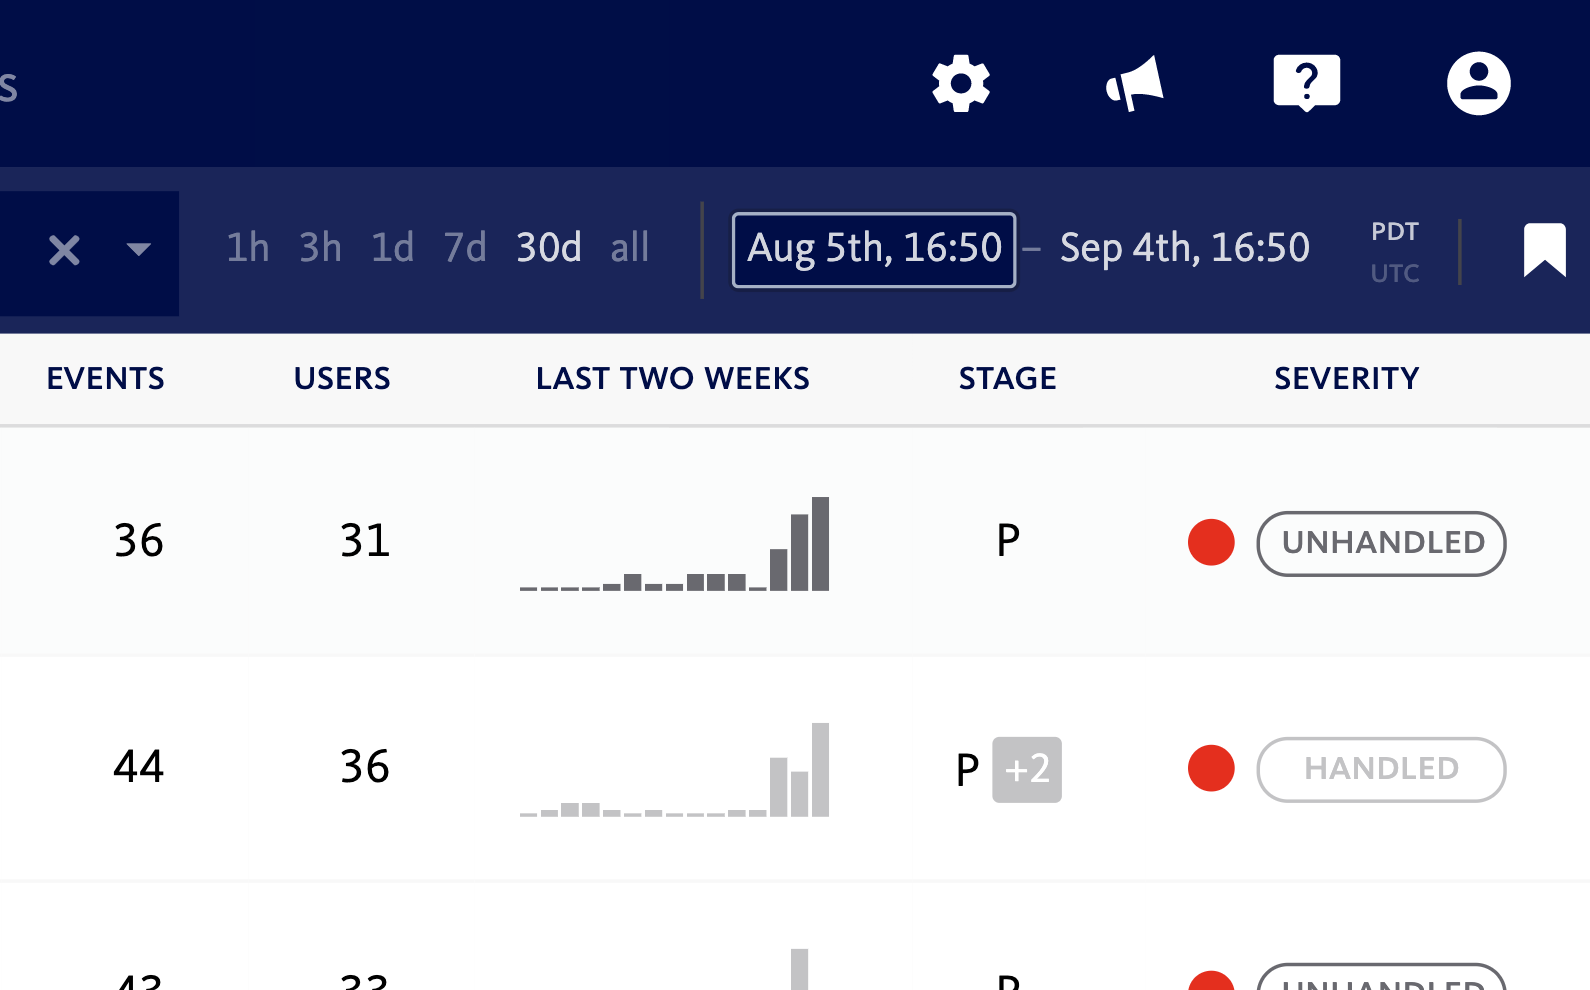
With your filtered data in place, you can get more specific by drilling down to a point in time. If you know that a spike of errors happened at a certain time, or if there were issues with a specific deploy, you can find that data easily with a time filter. There are preset times and dates, like 1 hour or 7 days, or you can type in a numeric or textual date into either or both of the date range fields, like yesterday or August 5th.
Filter Bar workflow in common scenarios
To help you understand how the filter bar can best work for you, here’s a look at three common development scenarios where error monitoring is valuable. We’ve also included the filters you can use to find the exact information you need.
Daily error review
At the start of the day, the right filters can help you understand the state of errors in your application. Filtering down to see errors introduced today helps you gain insight into what’s important to address right now. From this view, you can triage and address the errors that are most relevant, and even sort to see which are affecting the majority of your users.
Filters for daily error review
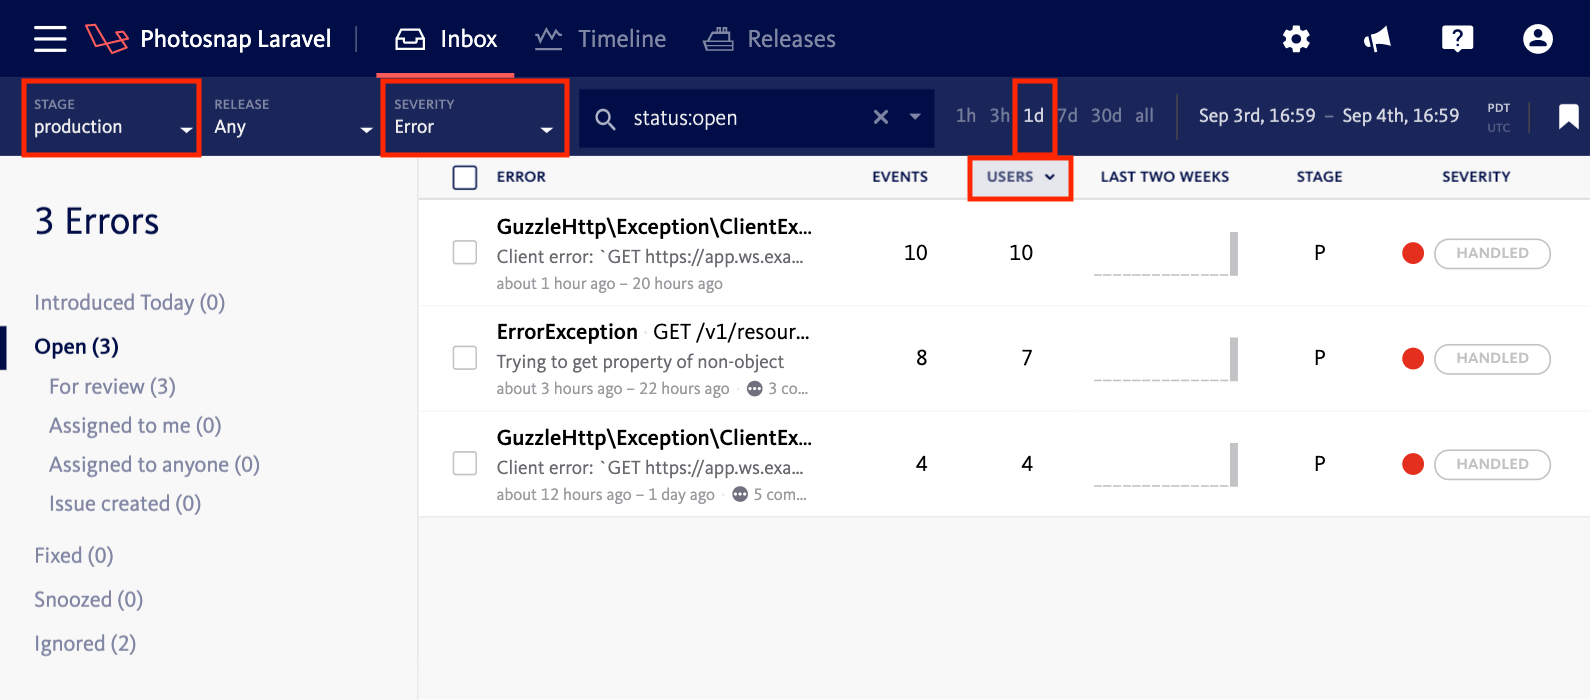
Here are the filters to spin up in order to access this data:
- Severity: error
- Release stage: production
- Time filter: 1d
- Sort: users affected
Triaging errors following a deploy
After you deploy a new version of your application, the Timeline page is the view for monitoring new errors that get introduced. At a glance, you can see if there’s been a spike in errors, letting you know to investigate its cause. You can set a time filter to the time of the deploy, combined with key/value filters to help you pinpoint the cause of the spike.
Filters following a deploy
After a deploy, you can use these filters to help you surface error data to understand its impact.
- introduced in version: As a jumping off point to investigate errors associated with a particular app version, you can use this filter to see errors that were introduced in specific versions.
- seen in version code: To find and fix errors on mobile, you can use this filter. It surfaces errors that affect applications tagged with a version code value that matches an exact version code.
- seen in deploy: You can use this filter to quickly test your hypothesis and address issues when you suspect that an error was introduced in a particular deploy.
Investigating user-reported bugs
You can also use the Filter Bar to reproduce bugs reported by your users. If you have a high value customer that’s seeing errors, you can find all information related to what they’re experiencing using filters.
Filters for finding user-reported bugs
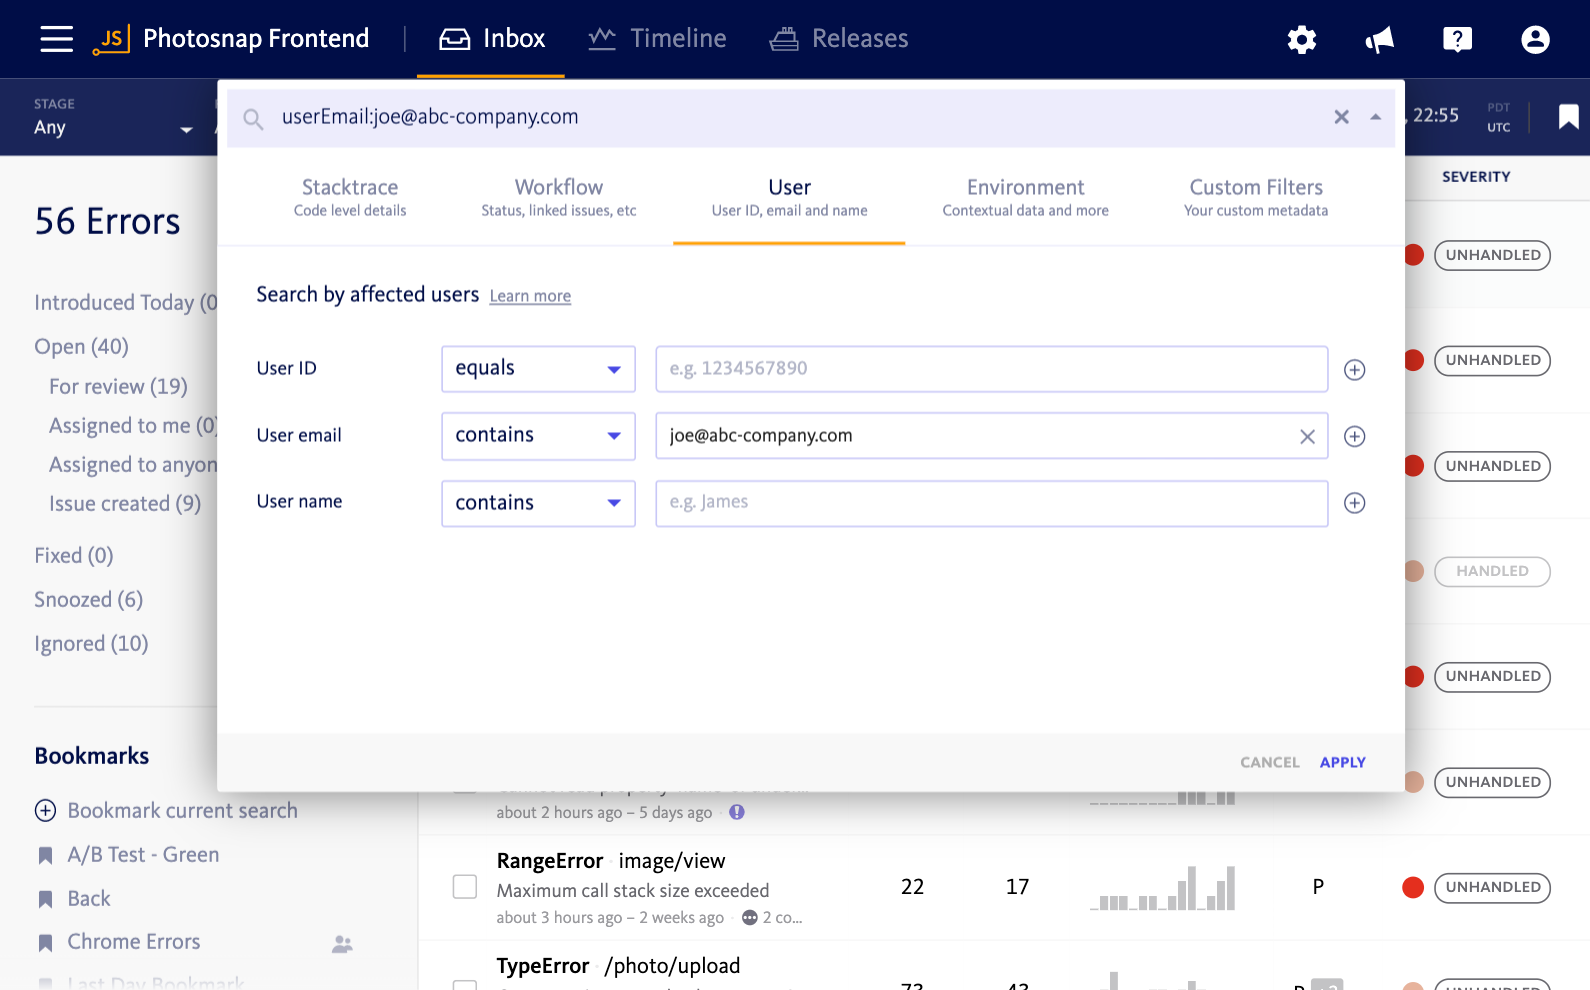
- user id, user email, request ip: These filters allow you to access all error data seen by a specific user, or subset of your users. With user email, you can filter by an entire domain, like bugsnag.com or gmail.
- browser name, browser version: Seeing which bugs are affecting which browsers, can help you identify which bugs are affecting the most critical subsets of your users.
Combining filters
Using the filters suggested above, along with other filtering options provided, you can combine multiple filters together to further specify the data you’re seeing.
For example, if you have a problematic deploy, but you don’t want this to impact sales revenue on large deals, you can combine the seen in deploy filter with the user email filter to make sure important potential customers aren’t being affected by bugs. If they are, you can reach out to them proactively to assure them all issues are being fixed.
We hope these examples will help you get up to speed with new universal filtering system, so you can benefit from the Filter Bar and spend less time finding and fixing bugs.
For more information on how to best use the Filter Bar, please feel free to look at our documentation.