BugSnag for Web

Easily identify and prioritize the most impactful errors
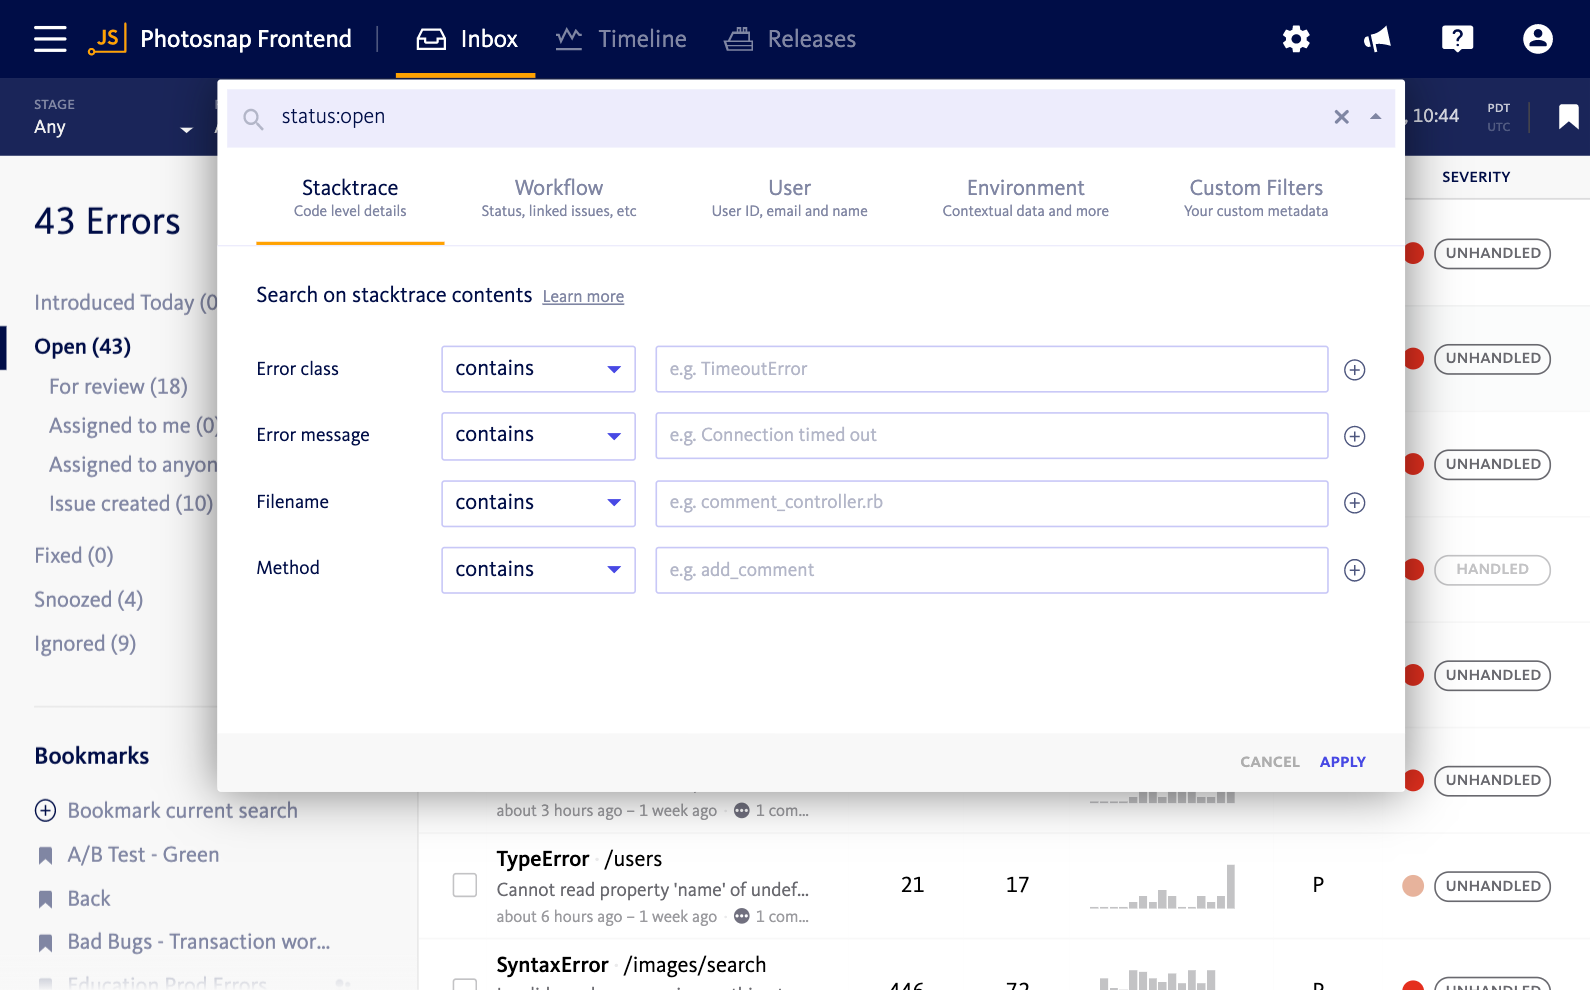
JS errors can really add up. BugSnag makes it easy to pinpoint the ones with the greatest
impact using powerful search and
segmentation, coupled with techniques like correlating errors to user or IP address
and versioning your code to track deployments.
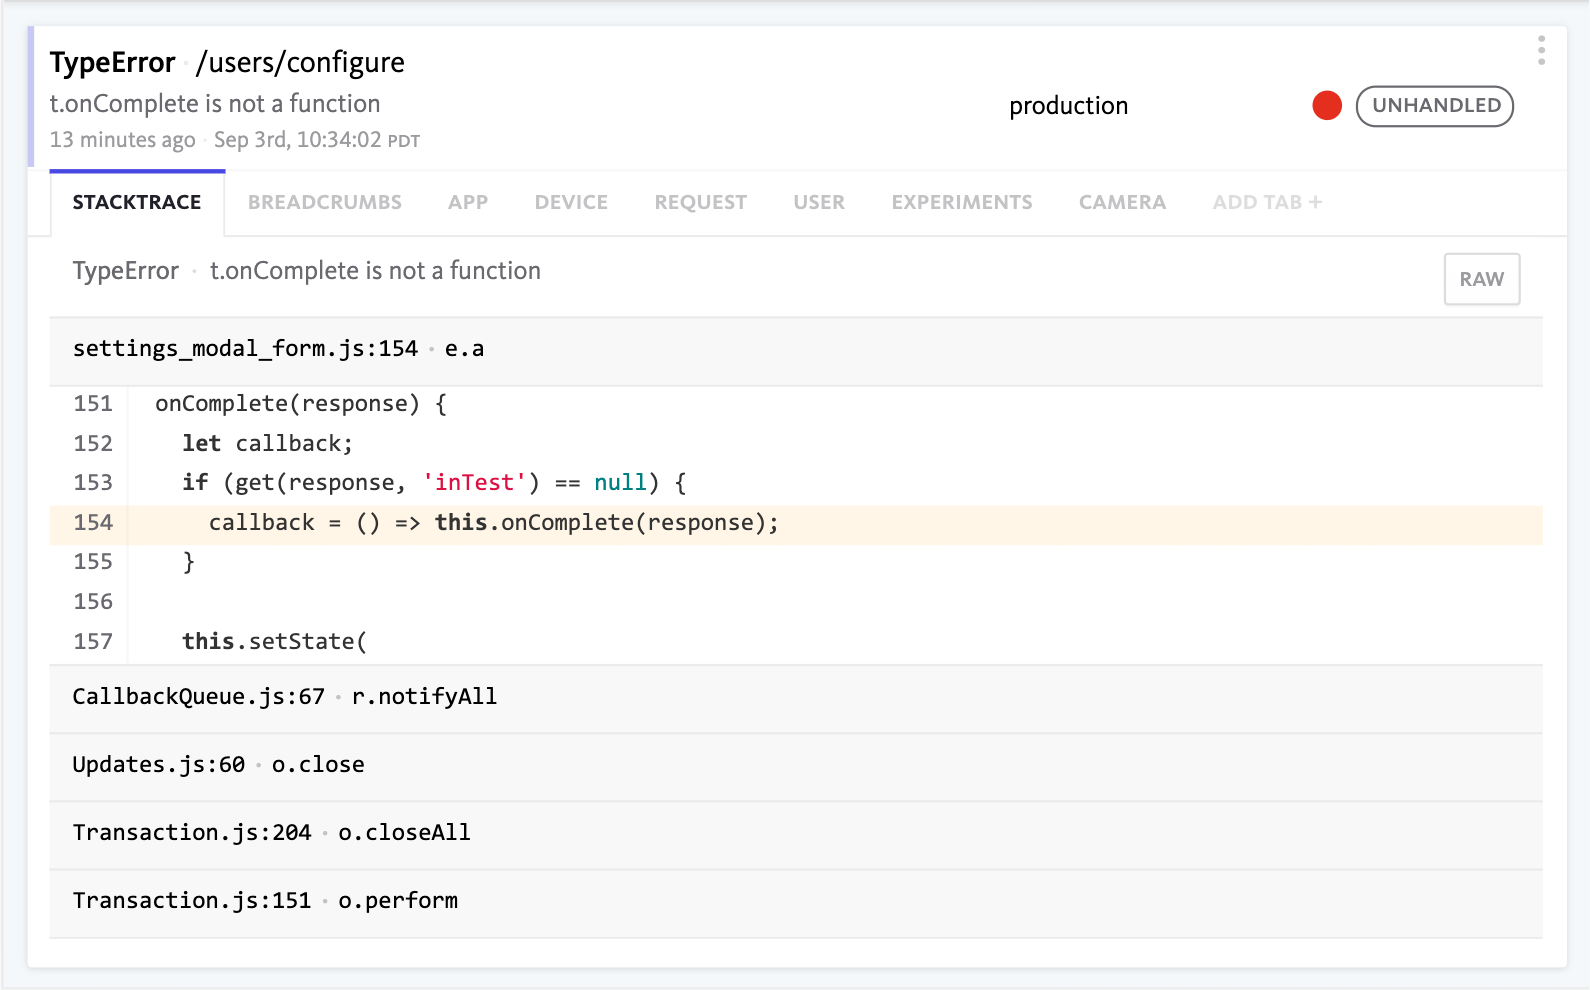
Faster debugging with detailed JavaScript error reports
A full error report makes it easier to reproduce and fix JavaScript bugs. BugSnag supports source maps so you
can see full stacktraces, even for minified code, plus breadcrumbs which give you a clear
understanding of how to reproduce a bug.
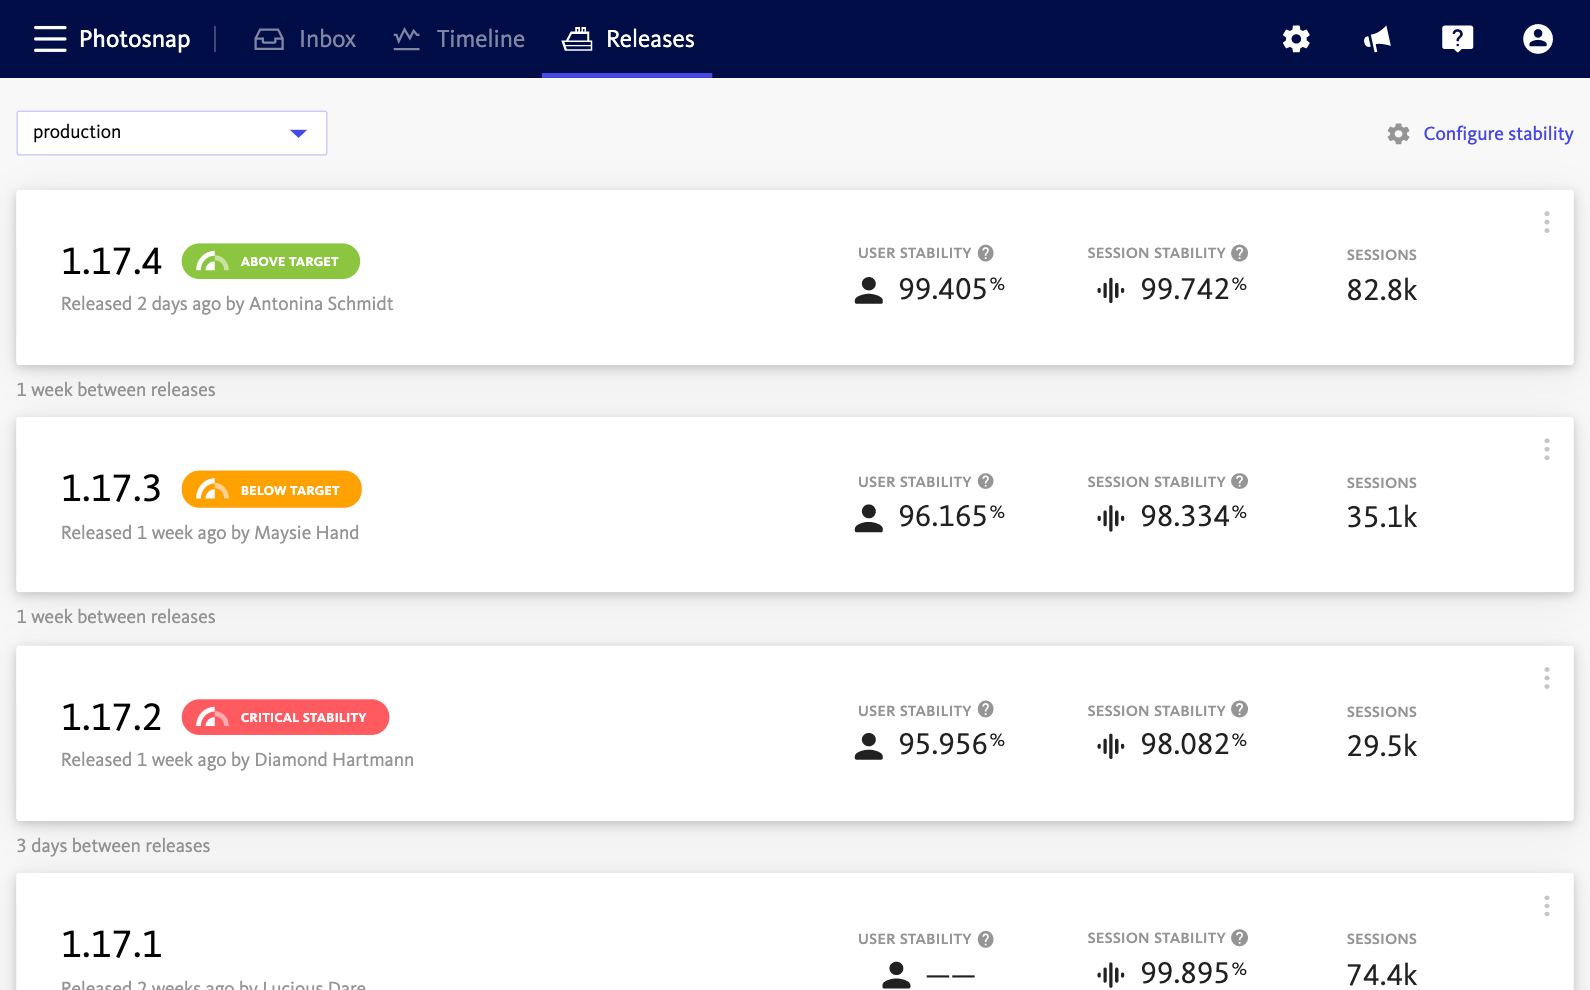
Know the health of your browser apps
When it comes to client side debugging, the high volume of errors can make it difficult to know when debugging is a priority. With the stability score, you can set a target for yourself, and when it drops too low, you’ll know it’s time to spend time improving app stability.
Provide high-quality user experiences for your browser-based apps
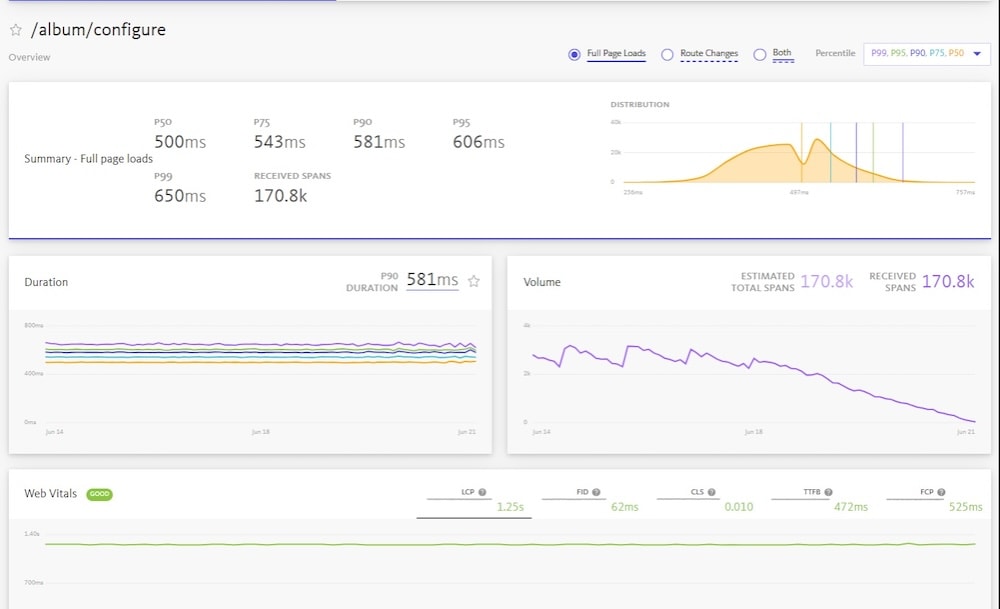
The rise in digital adoption isn’t limited to mobile apps. Ensure your browser apps are meeting user expectations by monitoring key performance metrics over time with real user performance data.
Monitor full page loads, route changes, network request spans and more to observe trends within your application. Oversee the three core web vitals to compare against Google benchmarks to improve search rankings and provide a better user experience for your site visitors.
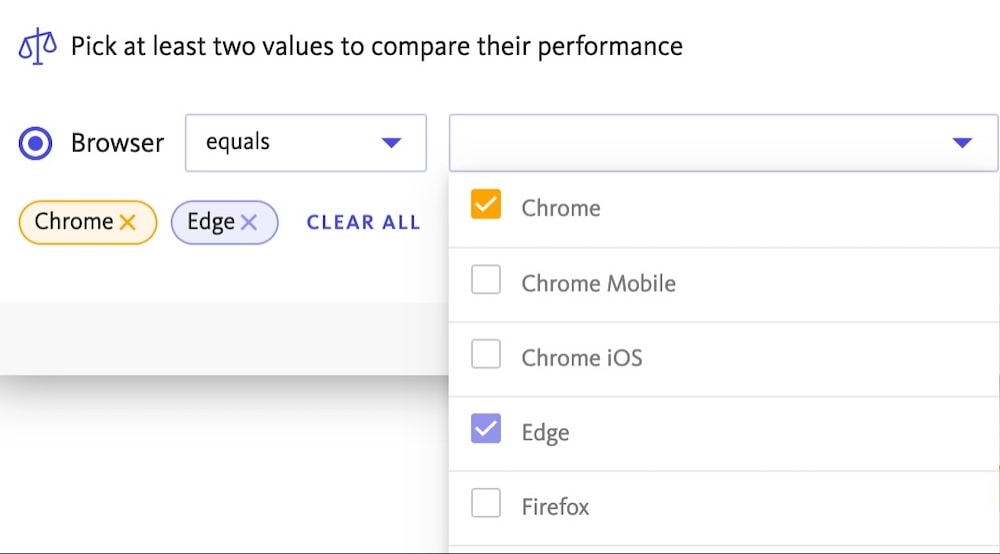
Get deeper insights with performance comparisons
Need to go beyond search and segmentation? Use the new performance comparison tool to highlight the performance of a span across segments. By configuring multiple filter sets, you can access a deeper layer of granularity of your app’s performance.
Whether it’s comparing performance metrics of your last few releases, or comparing performance between browsers, OS versions, or device type, the performance comparison tool allows you to identify key areas of improvement and streamline your workflow.
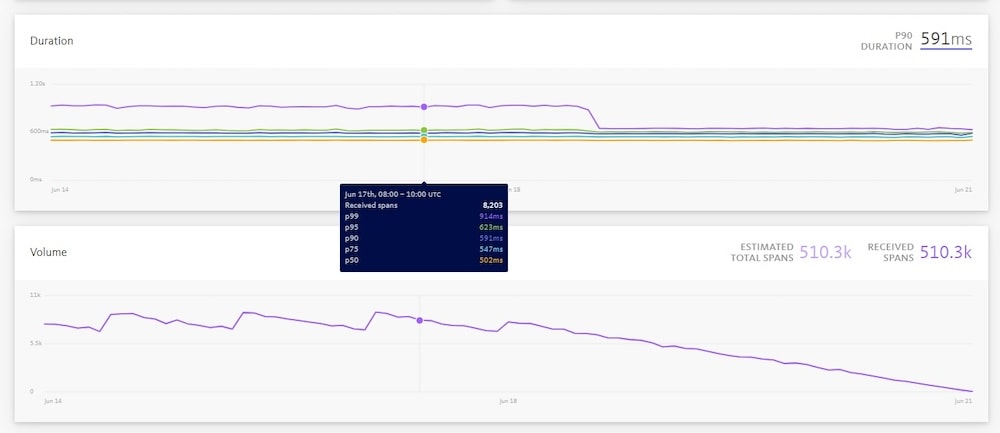
Observe performance trends with timeline views of action duration and volume.
Make it easier for you and your team to identify trends and spot performance issues. Examine trends of key performance metrics like web vitals and user action latency over time with our interactive timeline view that features up to 30 days of user performance data.
Click and drag on the timeline to zoom in on metric spikes for more granular analysis and additional context behind an issue.