
A Deep Dive into Performance Monitoring for SwiftUI
Most automated tests focus on hypothetical situations. But real-world users don’t always behave the way we want or expect. And typically, these unexpected behaviors are what produce errors.
We all want our apps to perform well, which is why we use performance monitoring solutions to show us how they are behaving in the wild. There are few things worse for your bottom line than a poor user experience – users get frustrated, they quit your app, and you lose out on their conversion.
Performance monitoring is critical for both front-end and back-end applications. For applications within the Apple operating systems, SwiftUI is a popular UI toolkit developed and released by Apple in 2019. Seen as an evolution in iOS development from UIKit, SwiftUI has several new features and improvements relevant to modern app dev teams. Let’s look at some details of performance monitoring for UIKit and SwiftUI apps.
Monitoring UIKit
For UIKit-based applications, UI performance monitoring has been relatively straightforward due to the callbacks that occur during a view controller’s life cycle:
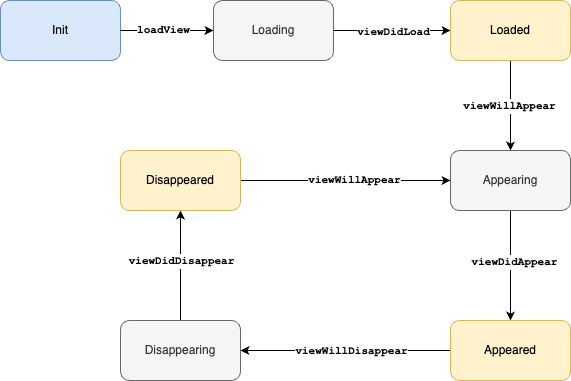
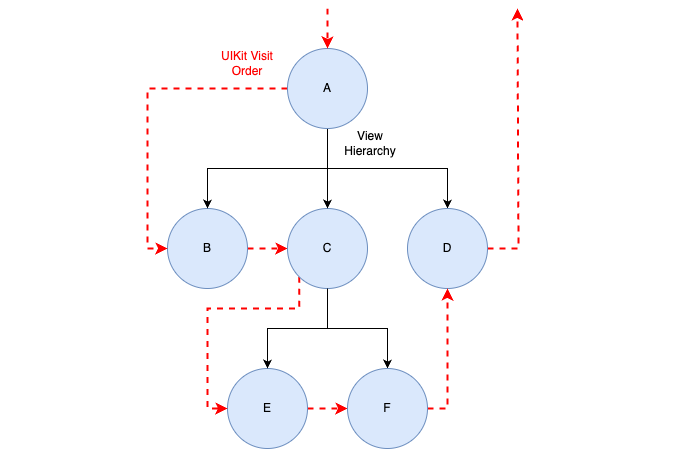
Because each view phase is bookended by a “will” and a “did” callback, one can simply swizzle those methods to record the start and end of a particular phase. And since they’re always called in a depth-first traversal (parent first, then child, then siblings), the phases in a view’s children naturally match up with their parents.
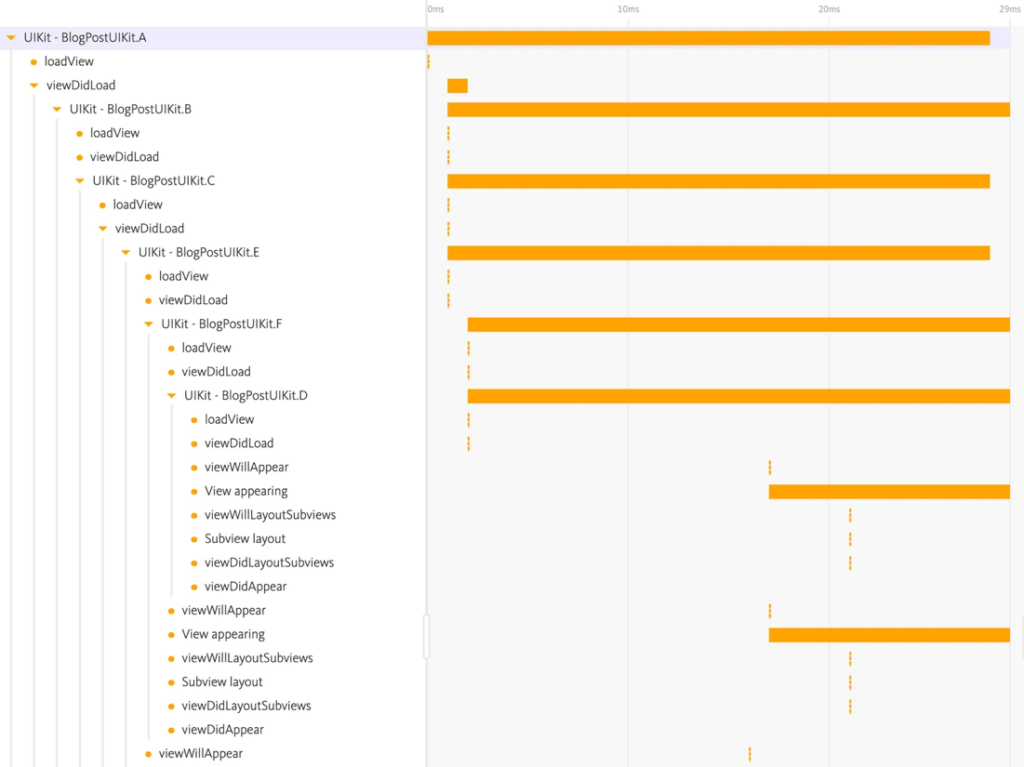
This gives us nice waterfall graphs in your dashboard view:
What about SwiftUI?
But what about SwiftUI? SwiftUI is a declarative framework, which greatly simplifies many aspects of UI building at a cost of some control. This loss of control has been problematic in the past for anyone producing more complex user interfaces, but over the past couple of years, Apple has steadily made SwiftUI more powerful, to the point where it’s now a viable replacement for 90% of app UIs out there.
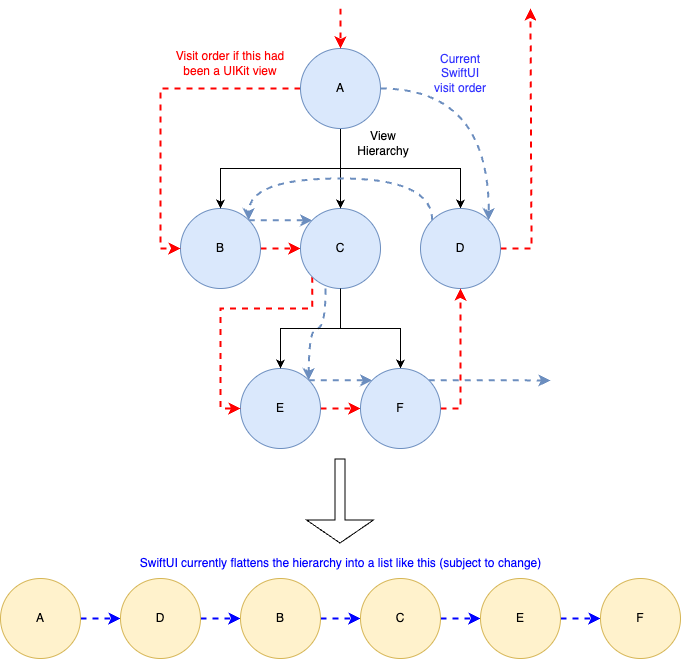
The main downside in terms of performance monitoring is you have far less observability, which means less data to measure with. Unlike UIKit, in SwiftUI the engine will add and remove views automatically as it goes about its business:
Also, SwiftUI lifecycle events are not run in recursive descent order, but rather the tree is flattened first, which makes predicting the processing order difficult (and in no way guaranteed – it could change with any SwiftUI framework update).
Our competitors simply convert the SwiftUI callbacks to spans and then consider the job done, but those “spans” are a lie because they aren’t measuring the duration of any user code at all. In BugSnag, we see SwiftUI event callbacks as points on the timeline rather than segments with durations. In modeling it this way, we can now estimate how long it took for component code to run:
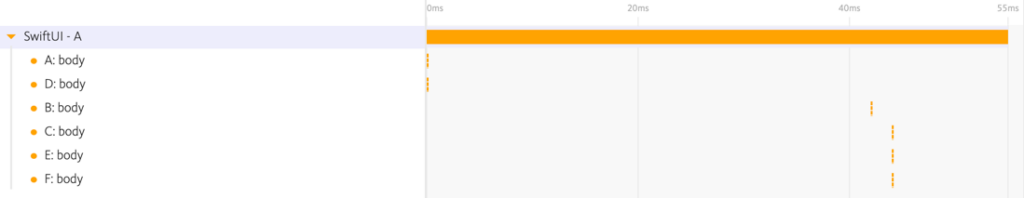
Here, we can see that the longest part of the view preparation happened between the body of views D and B.
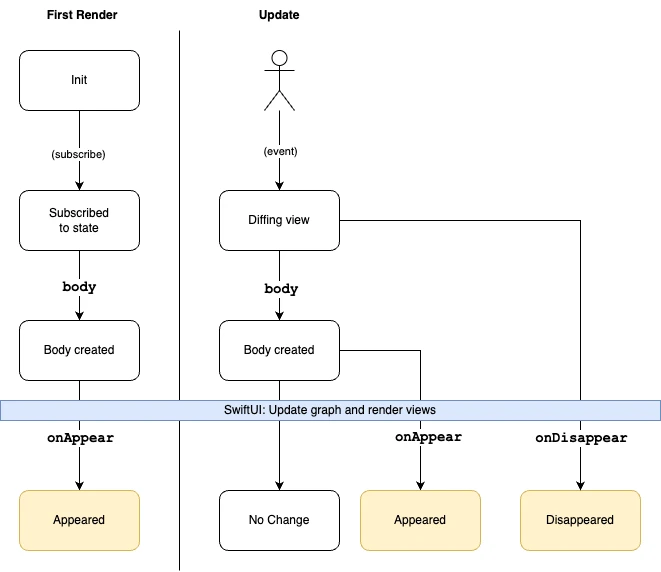
Taking the user-centric view
BugSnag SwiftUI performance monitoring also offers another feature to give you more control over how it monitors the view as it changes over time.
For example:
import SwiftUI

import BugsnagPerformanceSwiftUI
struct ContentView: View {

    @ObservedObject var model = MyModel()

    var body: some View {
        return VStack {
            if model.hasReceivedResponse {
                Text("Received response")
            } else {
                Text("Waiting for response")
                    .bugsnagTraced("Waiting for response")
                    .bugsnagDeferEndUntilViewDisappears()
            }

            if model.data != nil {
                Text("Received data")
            } else {
                Text("Waiting for data")
                    .bugsnagDeferEndUntilViewDisappears()
                    .bugsnagTraced("Waiting for data")
            }

            if model.hasReceivedResponse && model.data != nil {
                Button("Push me!") {
                        print("Pushed!")
                    }
                    .bugsnagTraced("My button")
                    .padding()
            }
        }
        .padding()
        .bugsnagTraced("Main")
        .task {
            // Simulate an async network request
            DispatchQueue.main.asyncAfter(deadline: .now() + 1.5) {
                model.onResponseReceived()
            }
        }
        .task {
            // Simulate an async data load
            DispatchQueue.main.asyncAfter(deadline: .now() + 0.5) {
                model.onDataLoaded(loadedData: Data())
            }
        }
        // Alternatively:
        // .bugsnagDeferEndUntil { model.hasReceivedResponse && model.data != nil }
    }
}

#Preview {
    ContentView()
}

class MyModel: ObservableObject {
    @Published var hasReceivedResponse: Bool = false
    @Published var data: Data? = nil

    func onResponseReceived() {
        hasReceivedResponse.toggle()
    }

    func onDataLoaded(loadedData: Data) {
        data = loadedData
    }

}
.bugsnagTraced() tells BugSnag that we are interested in the attached view. Its events will be recorded and presented on the BugSnag dashboard.
Notice the code .bugsnagDeferEndUntilViewDisappears() that has been appended to the two “waiting” text views. bugsnagDeferEndUntilViewDisappears() causes BugSnag to hold the current view load span open until the view it’s attached to disappears. Once all defers have been resolved, the span closes. This allows for a much richer view of how your view reaches a point of interactivity.
Compare this (no defers)…
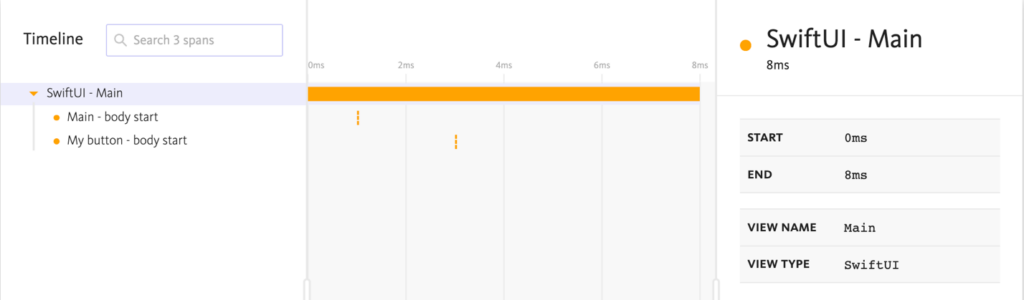
…to this (with defers):
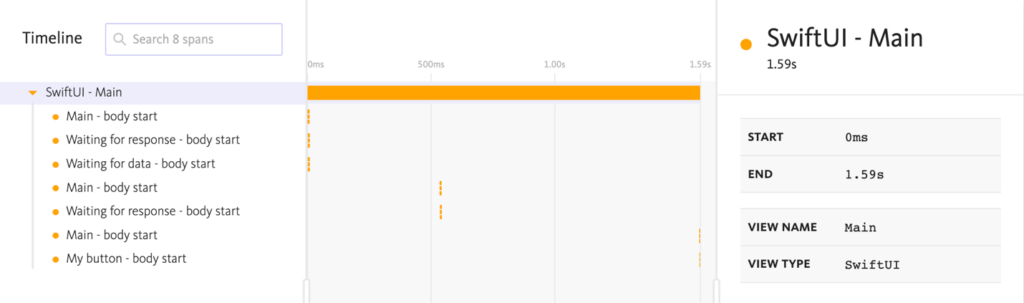
With defers, we can see how long it took for the data load task and network request task to complete so our UI is fully ready for user interaction, rather than simply how long it took for the view to appear.
Note: You can also use bugsnagDeferEndUntil() for more complex decision-making (you can see it commented out at the bottom of ContentView.
Conclusion
Hopefully, this gives you some insight into how SwiftUI performance monitoring works and encourages you to venture fearlessly into the future of Apple user interfaces with BugSnag by your side!
Do you need robust error monitoring, application stability, or real user monitoring capabilities? Try BugSnag free for 14 days.