Error and performance monitoring insights for JavaScript applications
Automatically detect JavaScript errors on your website and optimize website performance by monitoring real user experiences in real time.
Optimize your website’s performance
Get the insights you need to identify and fix performance issues with page loads, web vitals, route changes, and more
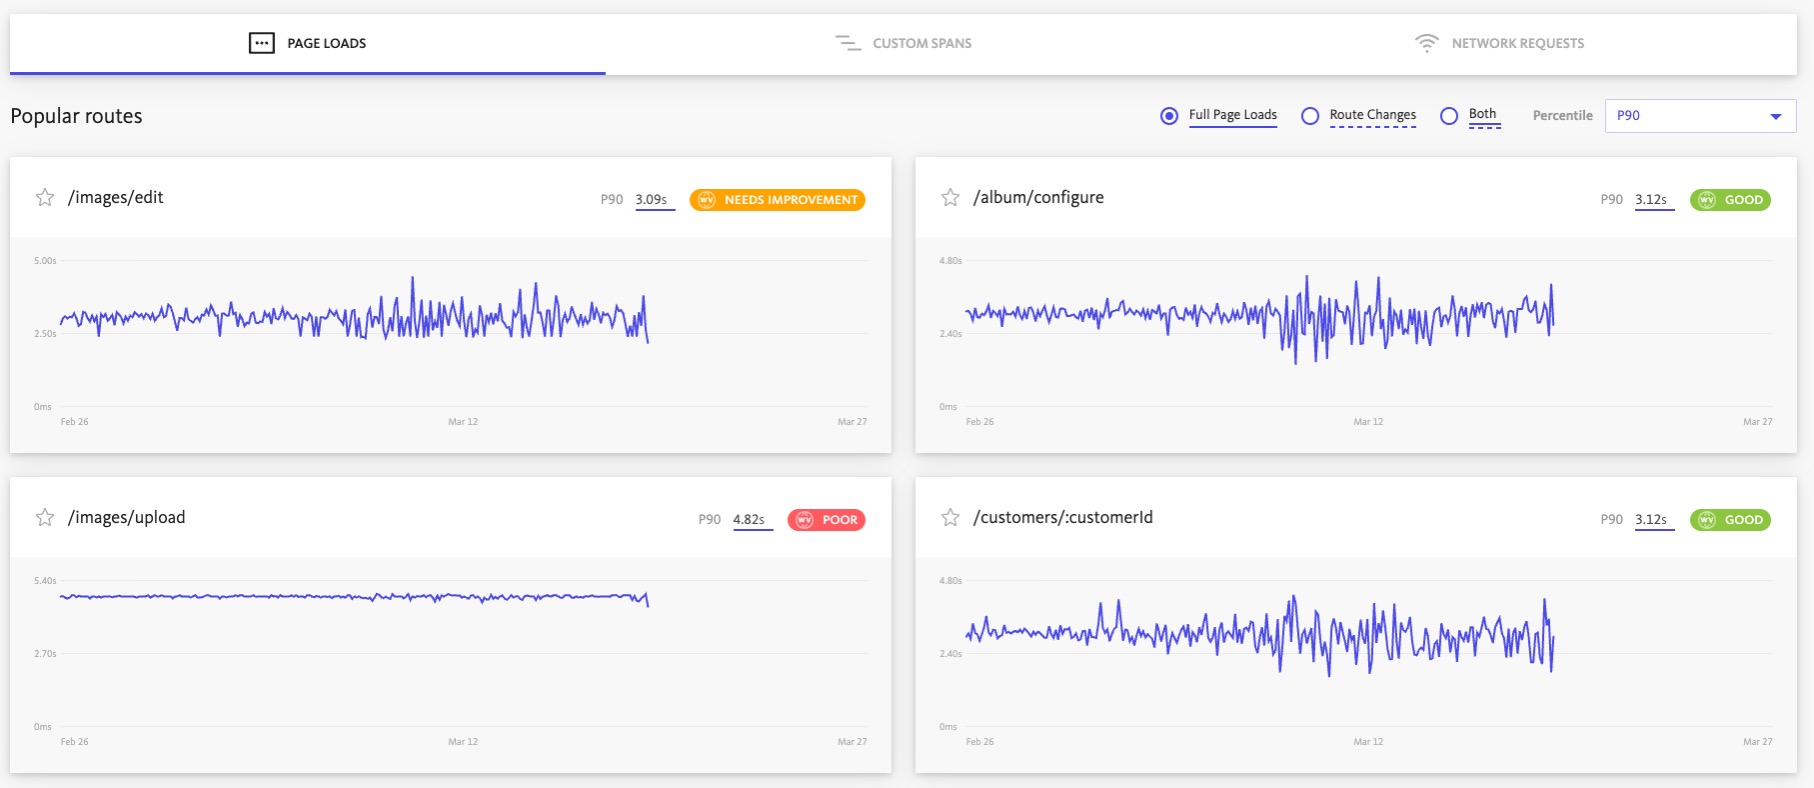
Real time browser performance insights
Real user monitoring insights into web performance to rapidly identify lags and get the context you need to fix the root cause. Leverage user metadata like browser version and device type to pinpoint exactly what went wrong.
24/7 monitoring of your web vitals and metrics
Monitor full page loads, route changes, network request spans and more to observe trends within your application. Oversee the three core web vitals to compare against Google benchmarks to improve search rankings and provide a better user experience for your site visitors.
Pay for insights, not data
Data is worthless without context. Get all of your cost-effective insights built to scale with your business and control data costs with dynamic sampling and OTel compatibility.
Effortless JavaScript error detection
Debug JavaScript errors more efficiently. Add one line of code to your website and focus on the issues that matter most to you and your users.

One line integration
Add a single script tag to your website or install via npm. It takes less than a minute to integrate and you'll immediately begin monitoring and reporting JavaScript errors.
Automatically detect script errors
Detect each time a user experiences an error. There’s absolutely no need to change your code or add try/catch blocks.
Notify your team instantly
BugSnag works with your existing developer tools. Keep a close watch on your JS app from places like Slack and Gitter, or with email and SMS notifications. Automatically create tickets in JIRA, GitHub Issues, Pivotal Tracker, and more when a new error is found.
Support for JavaScript frameworks
BugSnag supports JS frameworks React, Vue, and Angular with error reporting libraries that hook into your frameworks' error handler and report framework specific diagnostics.
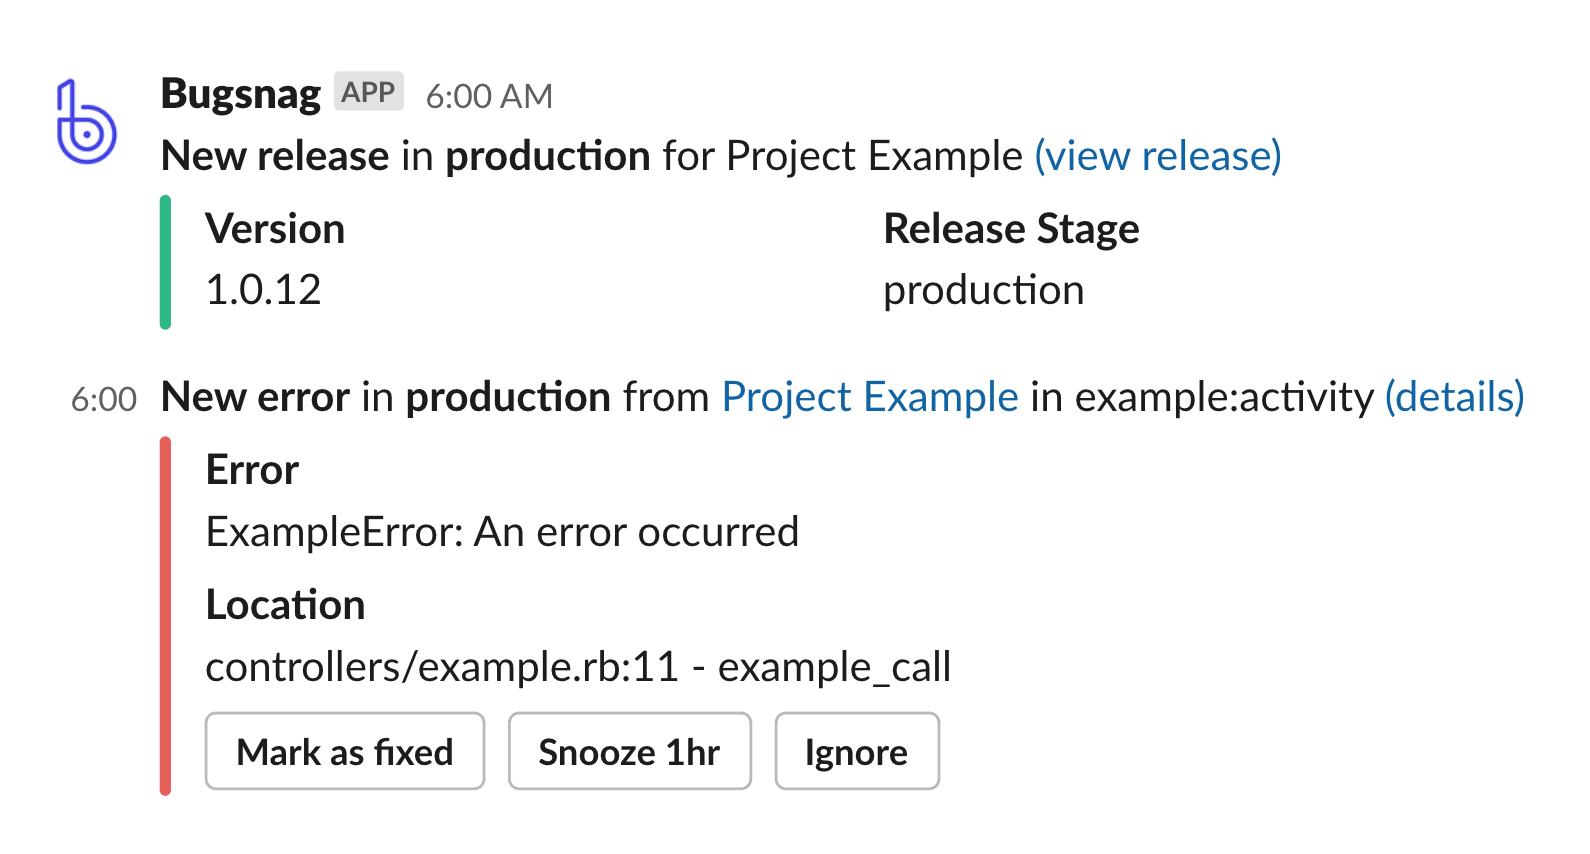
Cross-browser error detection
Ship new code with the confidence that you'll be able to quickly respond whenever JavaScript errors happen, wherever they occur.

Cross-browser error grouping
From old IE to modern Chrome, monitor your JS errors everywhere. See your errors from modern browsers grouped together flawlessly, even if you use minification and cache-busting techniques.
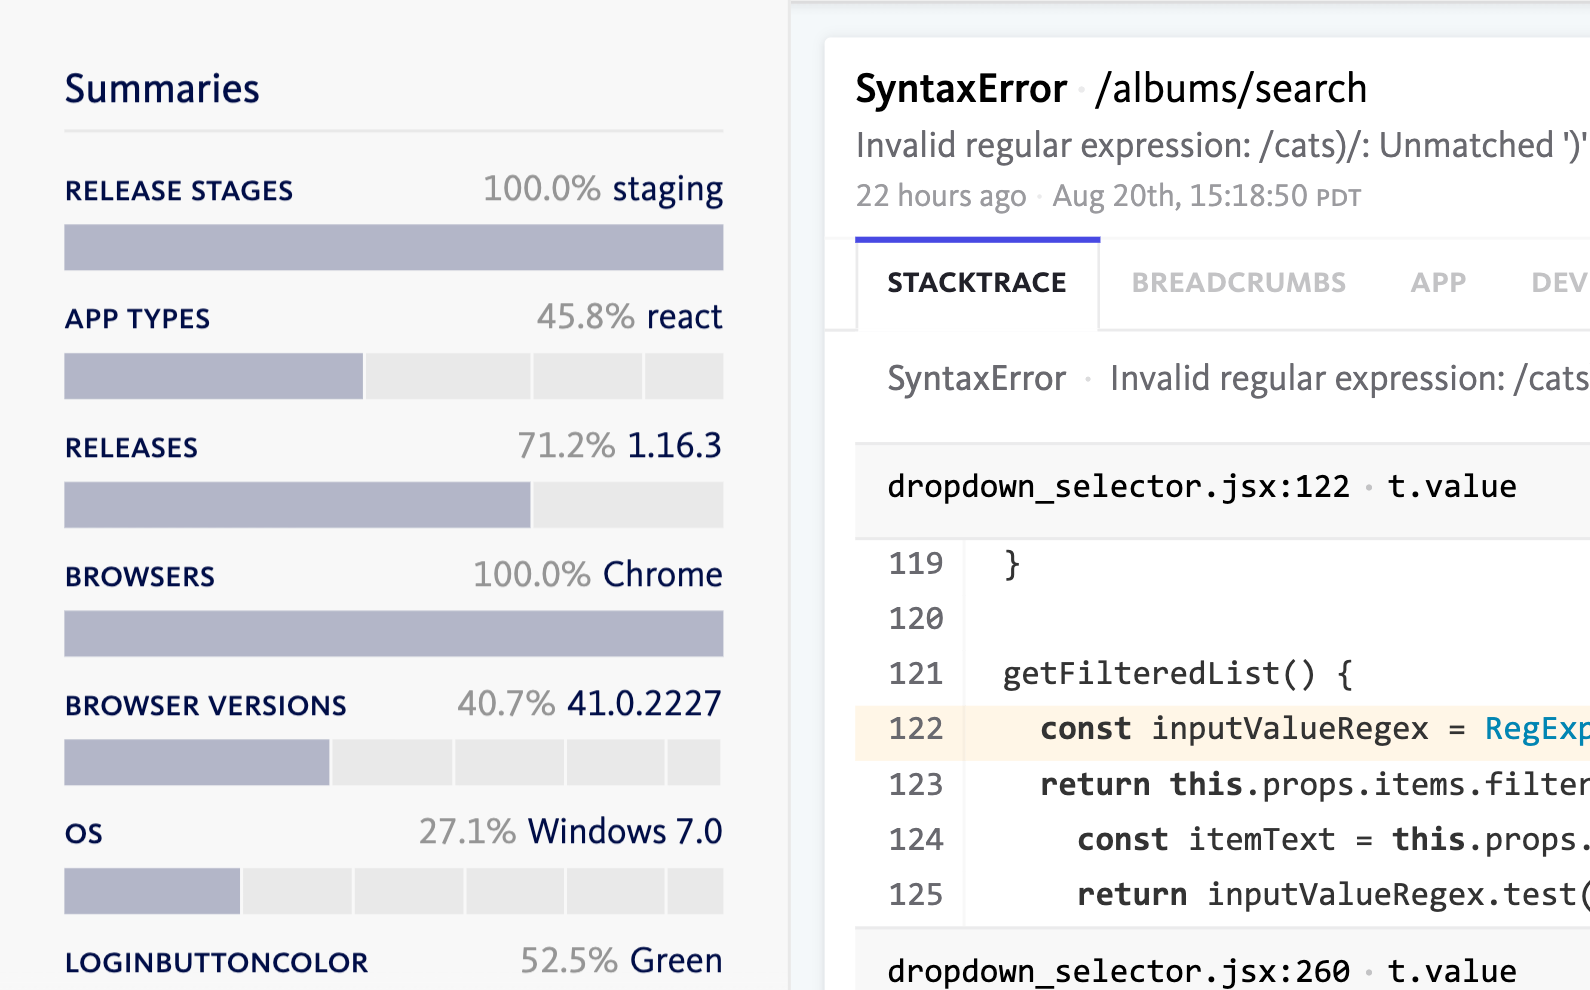
Browser and OS Breakdowns
See the breakdown of the browsers and operating systems in which errors occurred. You’ll be able to quickly identify if an error is limited to a single browser, or a class of browsers.
Prioritize your JavaScript errors
With error sorting, filtering, and trend analysis, keep your team focused on the issues that matter most.
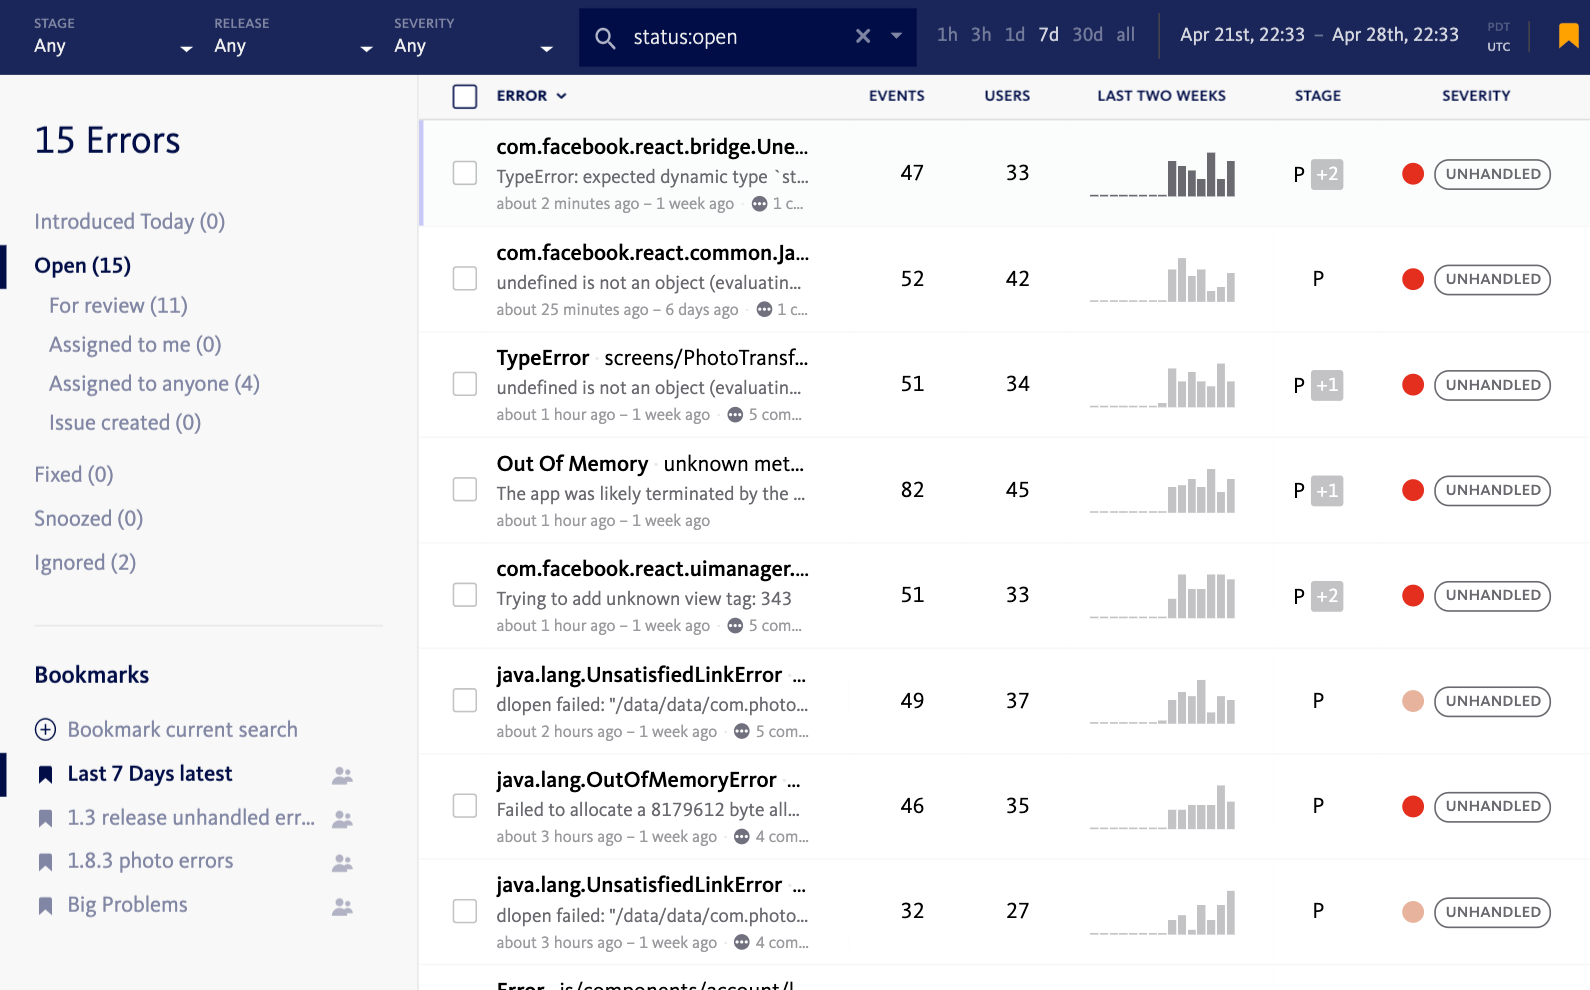
Avoid the noise
Multi-dimensional filters for browser, OS, user, and more help you hone in on relevant errors. Easily filter to find specific errors you're looking for and clear away noise from your view.
Identify impactful errors at a glance
Sort errors by event count and users impacted to find the ones that occur most frequently or affect a widespread section of your users. This can help you prioritize errors that need fixing.
Benchmark releases to improve application health
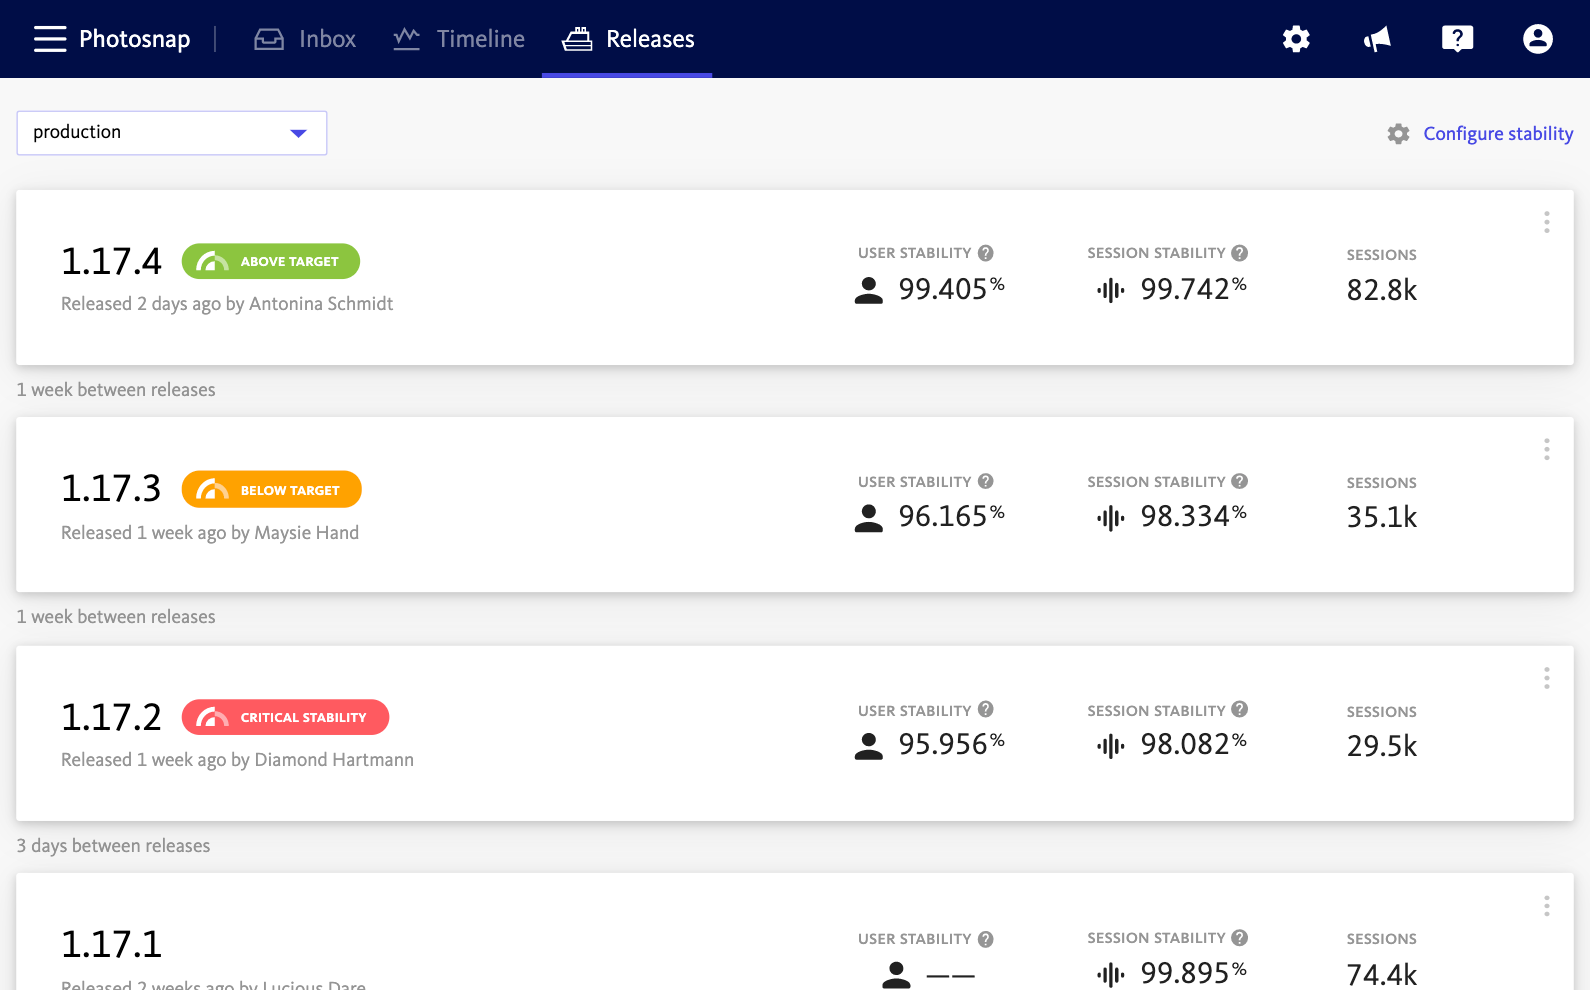
Use the Releases dashboard to decide if a release is successful or needs to be rolled back. The crash rate indicator shows the percentage of sessions in a release that end in a crash, allowing you to compare release health and track improvements over time.
Automatic diagnostic collection
With access to powerful diagnostics, get to the root cause of errors quickly and fix frustrating bugs.
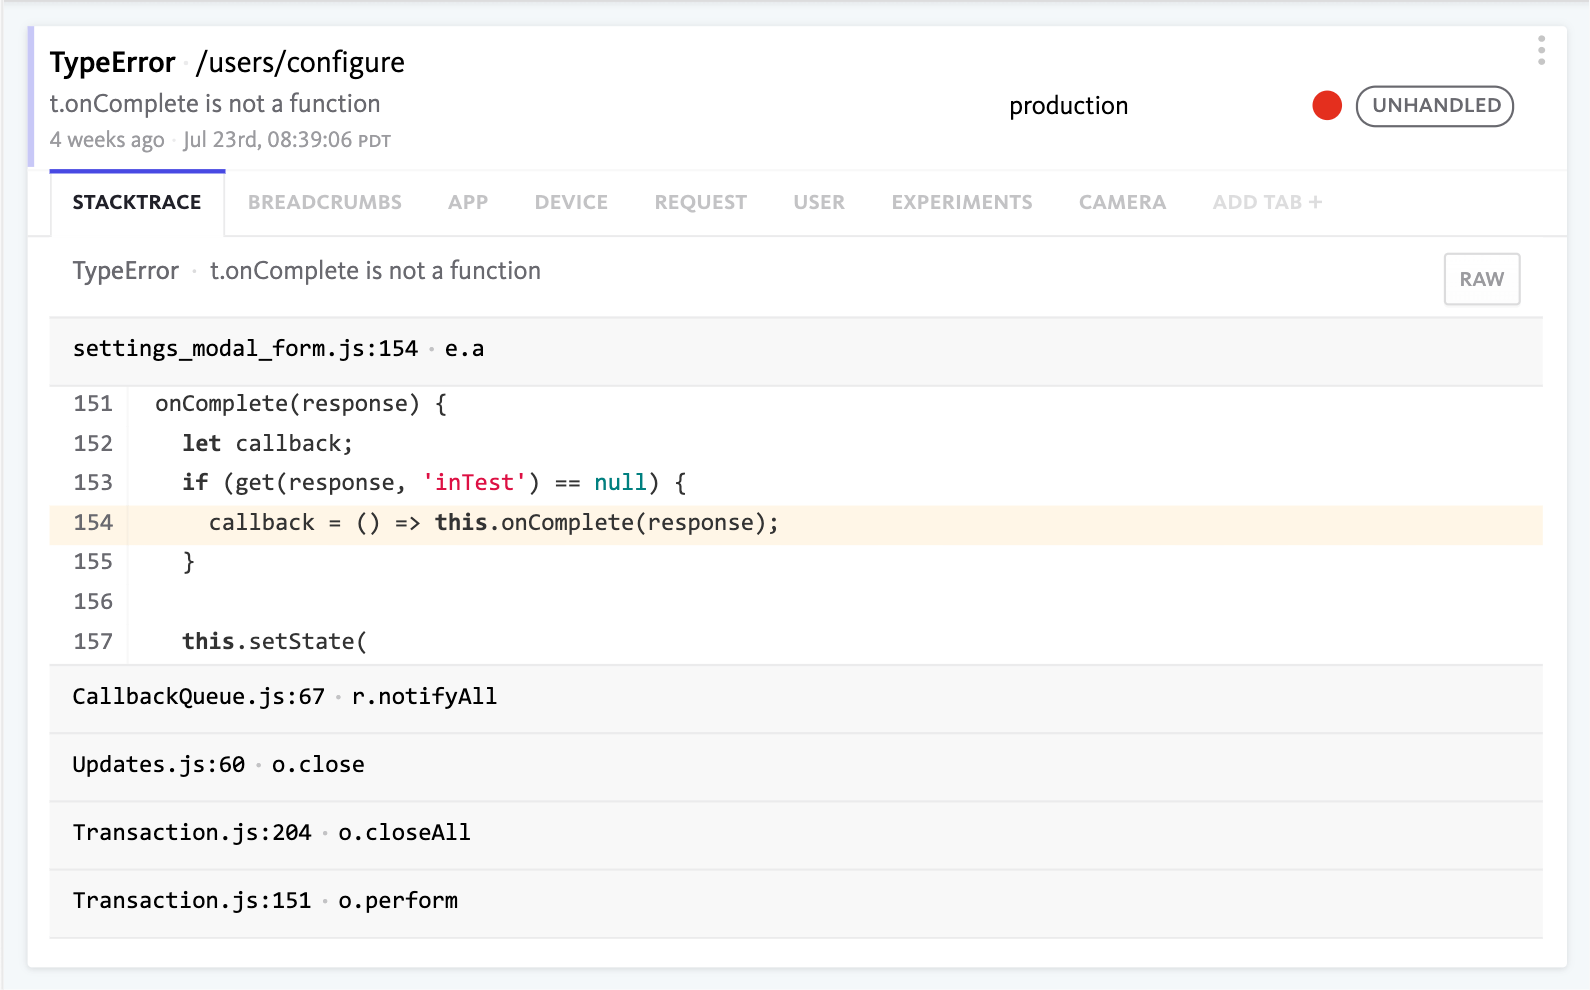
Stacktrace and source maps support
See the code that caused the error, even if your code is minified. If you’re using source maps we’ll show you the exact line that caused the crash.
Automatically collected breadcrumbs
Efficiently reproduce errors with a timeline of user and system events leading up to each error, like clicks, console logs and errors, page load, and more.
Developer-first observability insights into JavaScript apps
Resilient JavaScript error and performance monitoring that's used on some of the world's biggest sites. We'll be here when you need us most.
Lightweight library
Weighing in at less than 10KB, our JavaScript code adds no noticeable overhead to your page loads. The library is hosted on Amazon’s Cloudfront CDN with edge locations around the world — or you can host it on your own servers.
Open source
All BugSnag notifiers are open source so you can see the exception handling code and even make pull requests to suggest improvements.
Enterprise level security
Send errors to our servers using 256-bit SSL, the same encryption used by the world’s leading enterprises. You can host BugSnag on-premise for complete data control.
What customers are saying
Stacey Snyder
Sr. Director of Engineering, Recurly

Software Engineer, Chime

Nahuel Barrios
Engineering Manager

Antonio Niñirola
Engineering Manager

