Error monitoring for devs, by devs
No more guessing about what to do next
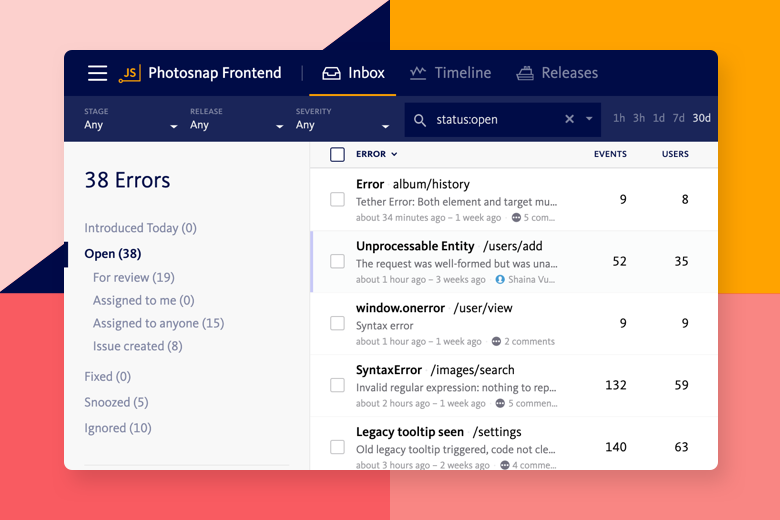
Get relevant snapshots in the Error Inbox
See all your crash data and visualize the health of your application in the Error Inbox. In the Inbox, you can see the details for every error and triage each issue accordingly.
BugSnag's grouping logic uses the root cause of a crash in order to group instances of the same underlying error together. This helps minimize noise, as well as identify the most relevant crash data in the Inbox.
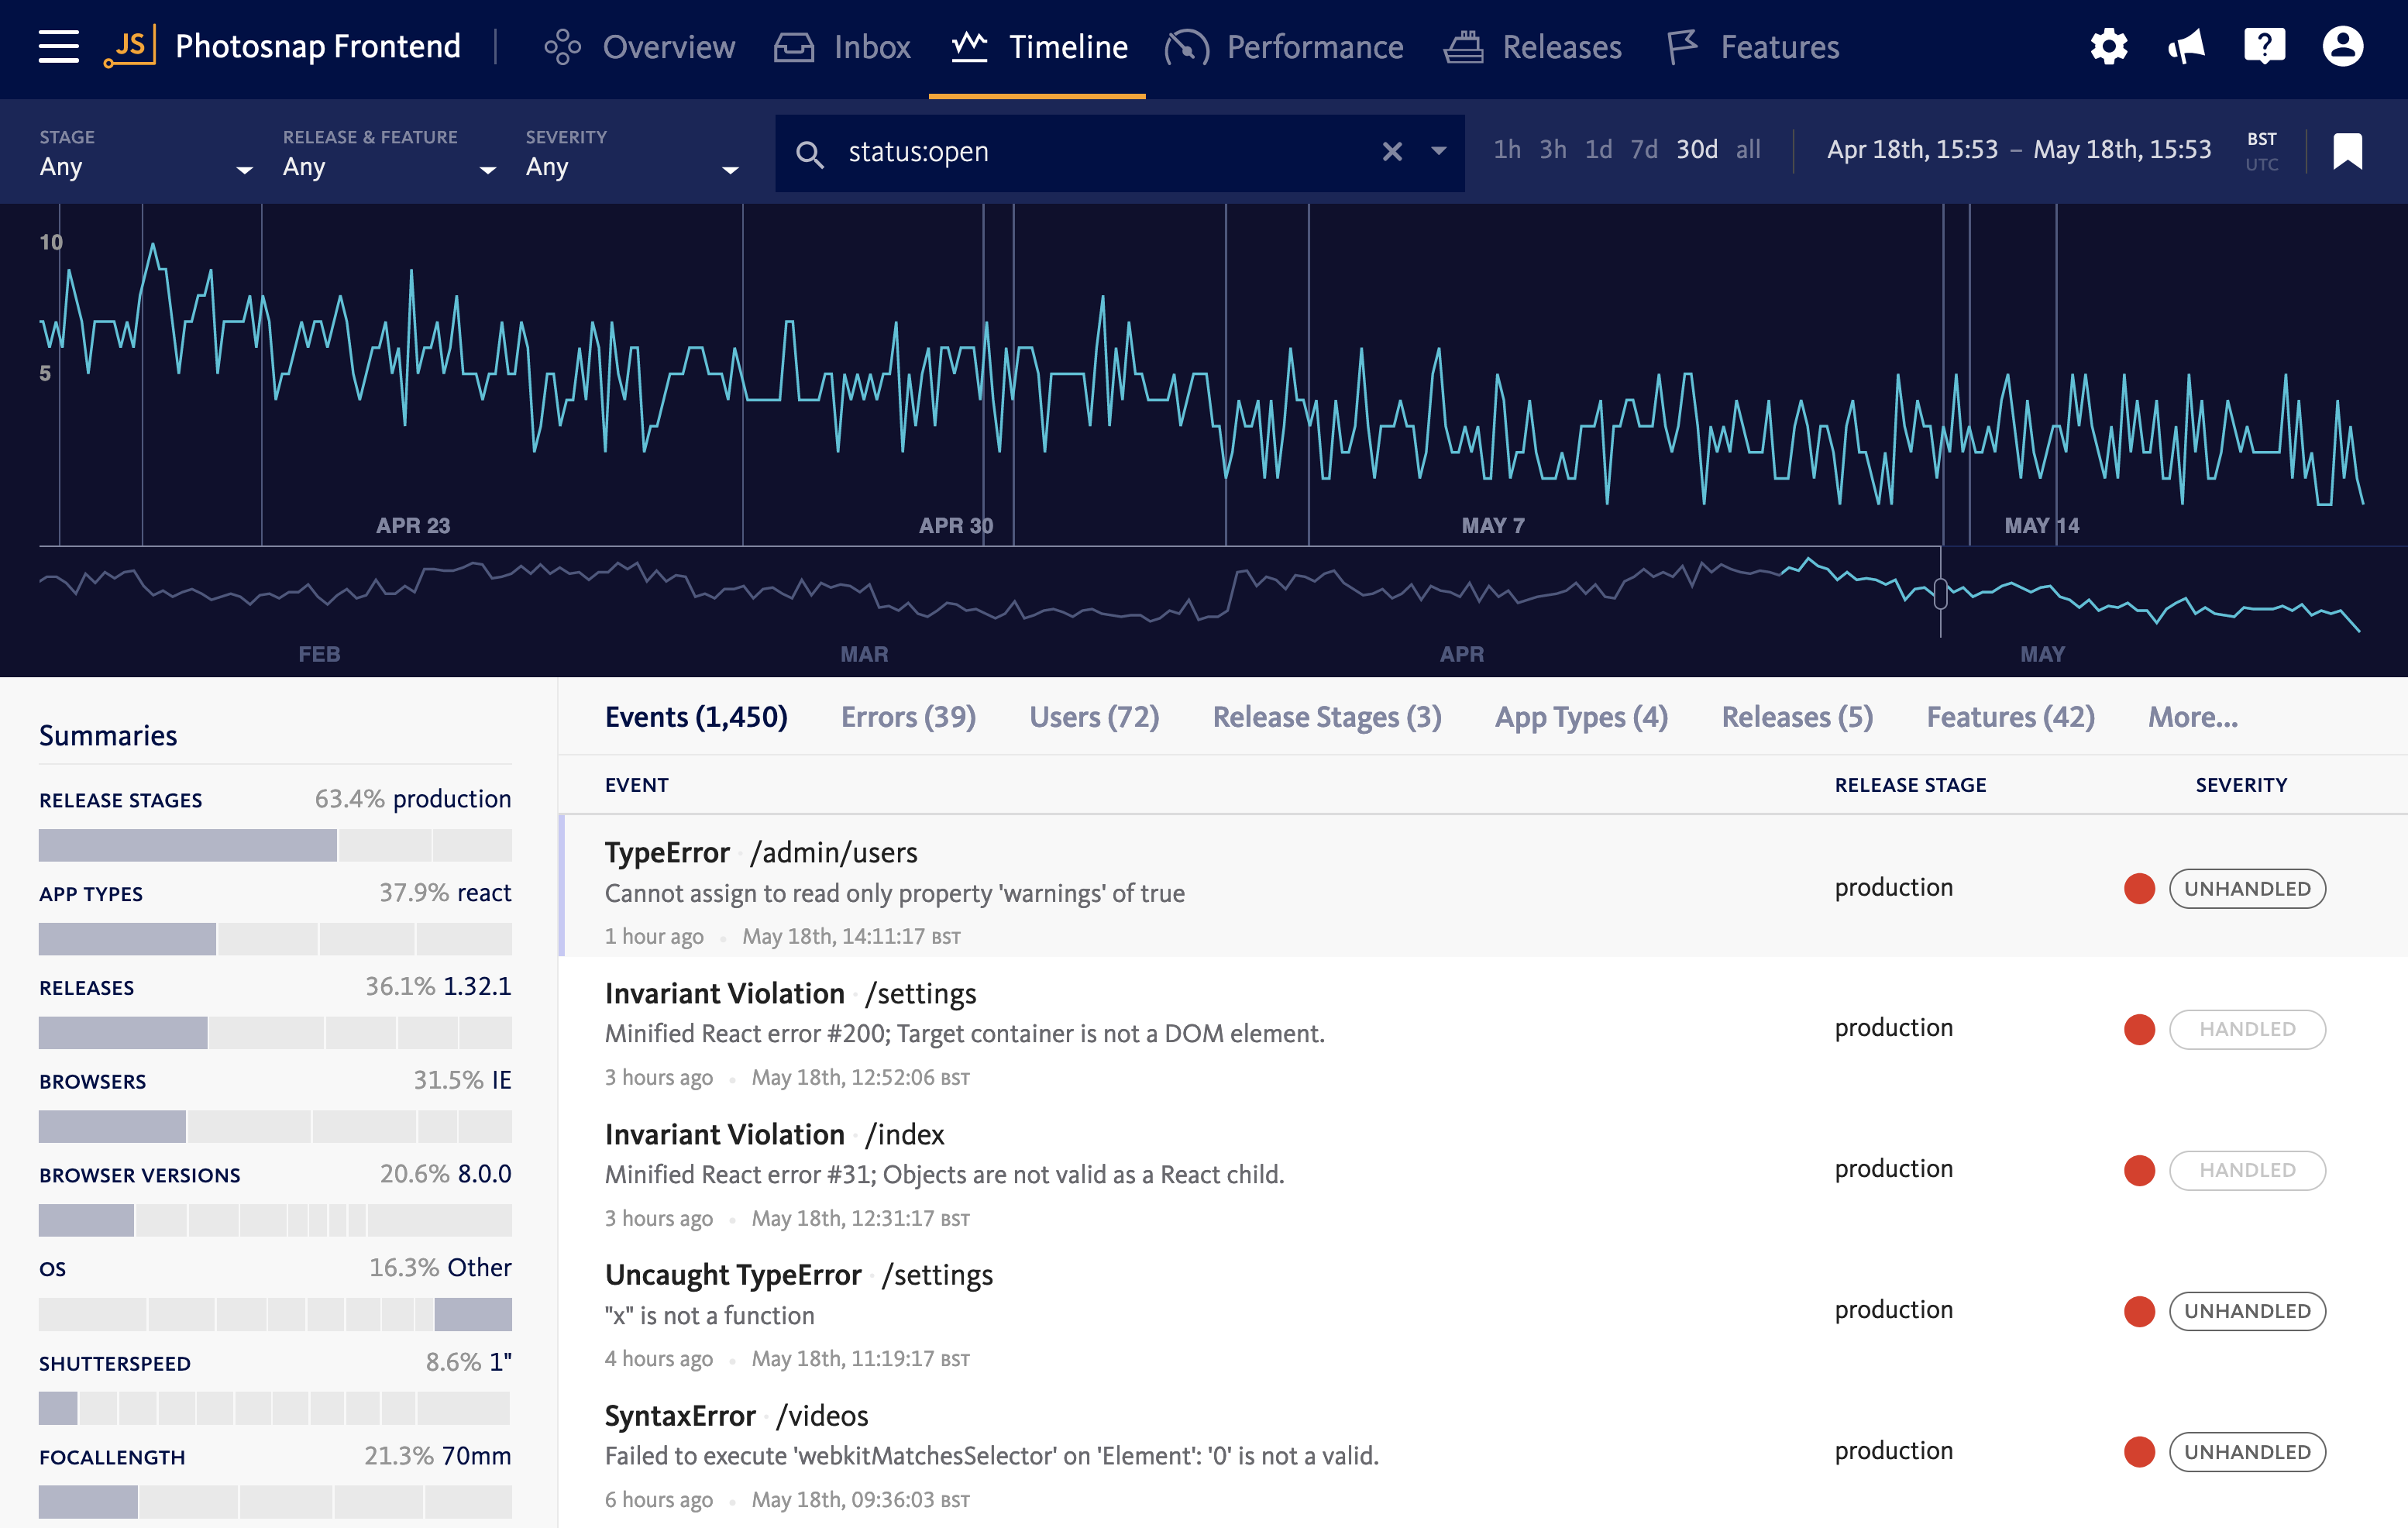
Track important trends with the Error Timeline view
Investigate errors and stability issues on the timeline to understand error trends, pinpoint error spikes, investigate specific incidents, or determine if a release introduces new bugs.
You can zoom in and out on the interactive timeline to see error spikes or expand to see micro-level details. The timeline supports searching and segmentation, so you can drill down to find errors from specific time periods, users, release stages, and operating systems.
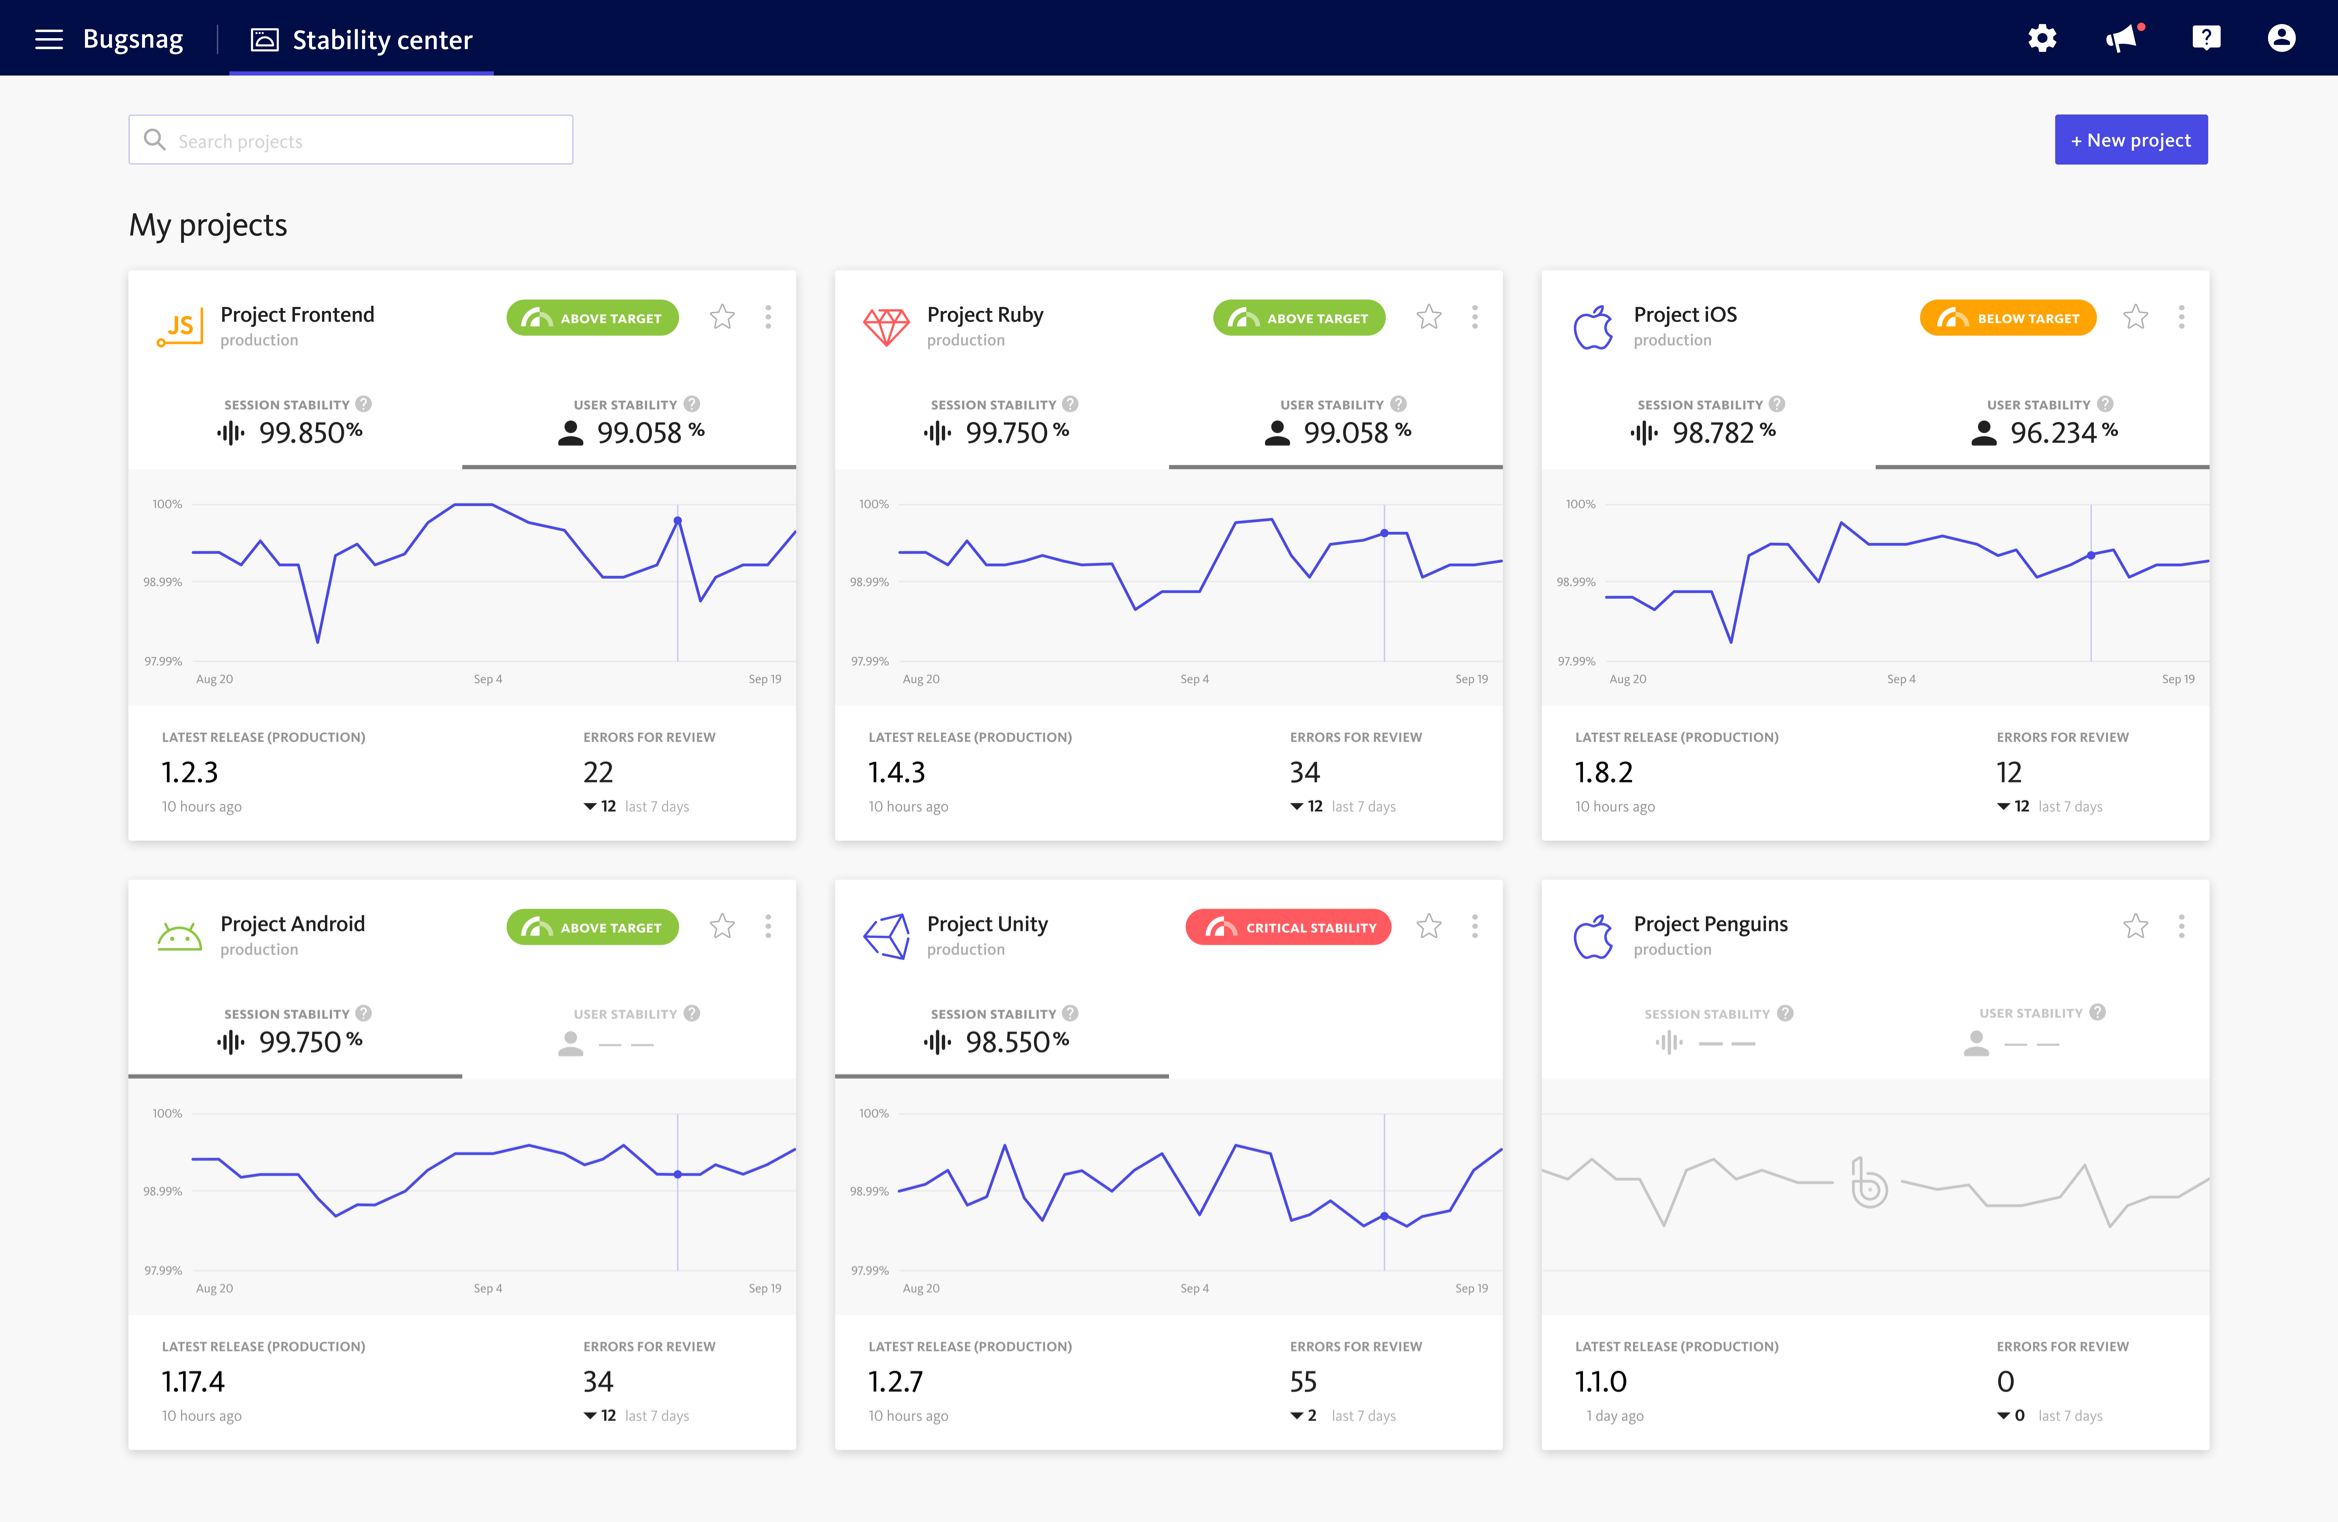
Gain insights into the stability of all applications in the Stability Center
See 30-day stability scores and trends graphs based on users or sessions for each application to understand how the stability has changed over time and if the team is trending towards achieving stability targets.
Make data-driven decisions about which applications the engineers should prioritize for debugging to improve stability and customer experience.
Create custom workflows, filters, bookmarks, and more
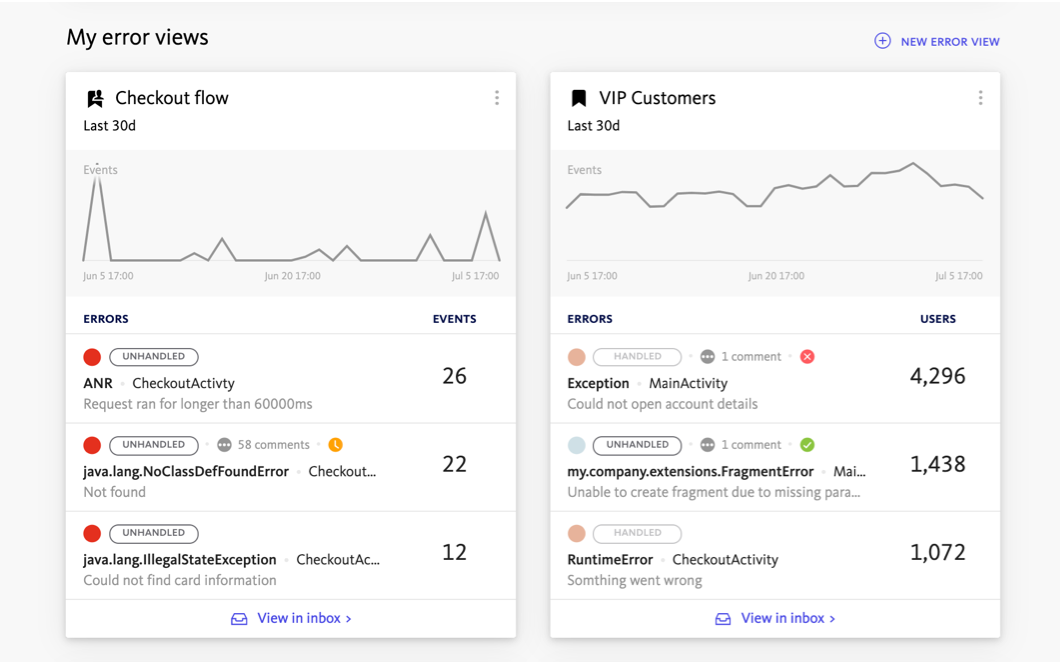
A personalized view of your app’s errors
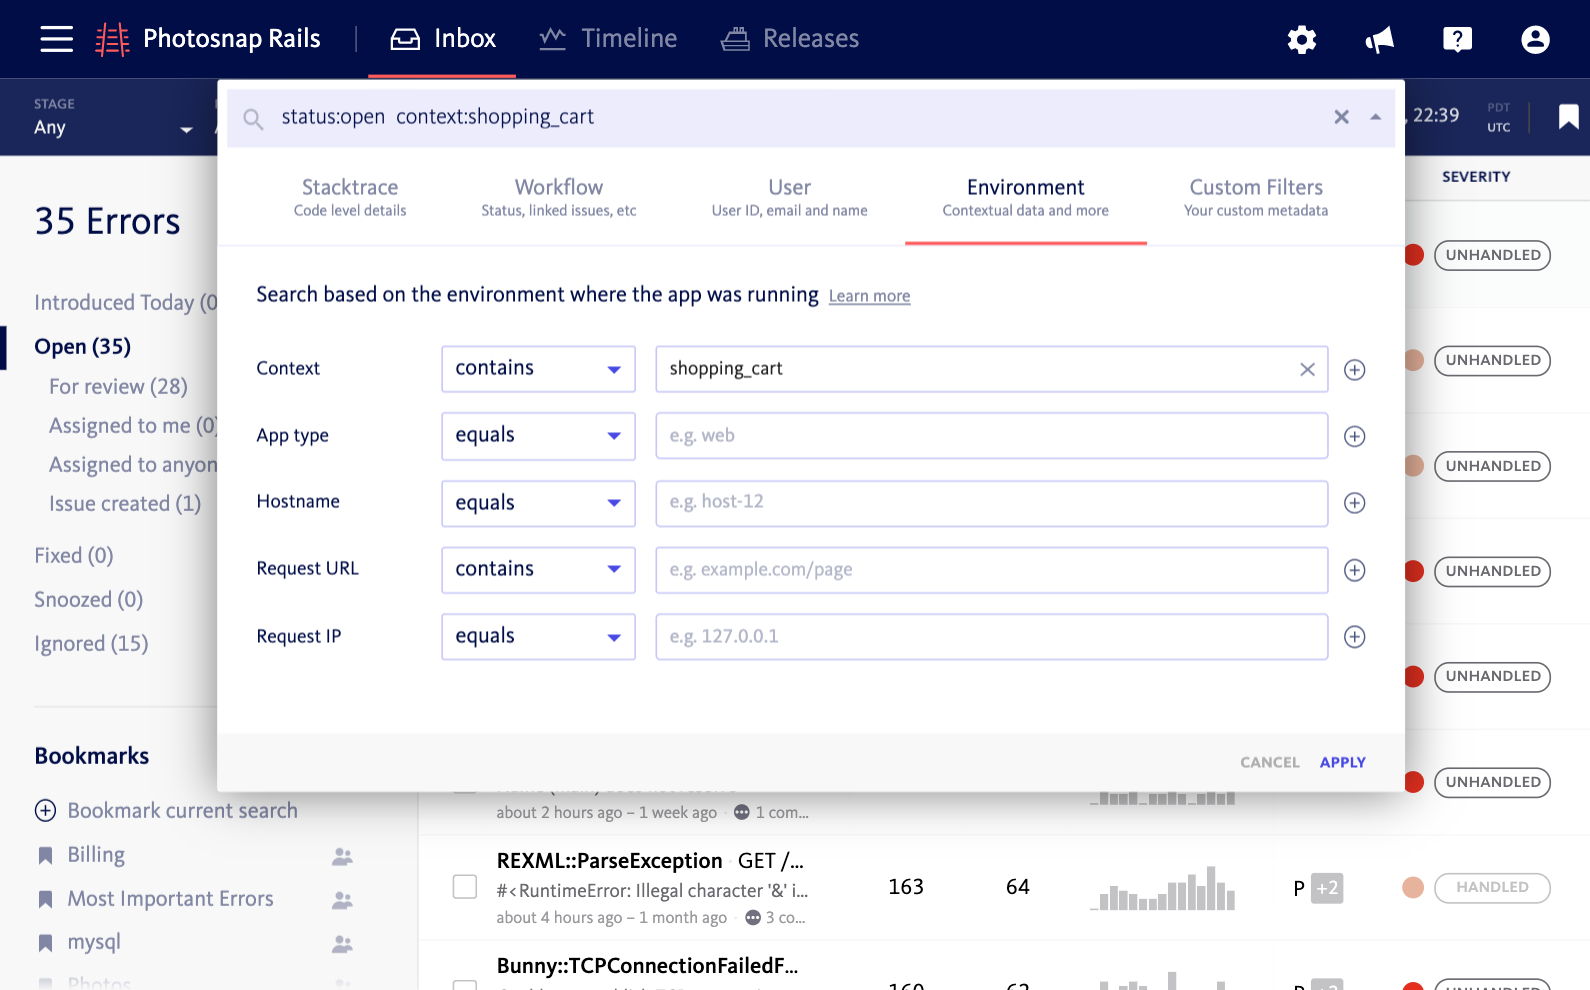
Create custom filters for errors on multiple attributes and save the search filters with bookmarks. Use custom bookmarks to keep track of error segments that matter to you, like errors impacting VIP customers, originating from your codebase, occurring in A/B tests or impacting critical app functions.
You can also use bookmarks to create custom error views in the Project Overview Dashboard and keep an eye on how errors are impacting segments that are important to you so you can prioritize and fix them.
Segment by the application area you’re responsible for
Surface the errors most relevant to you or your team by bookmarking a segment of errors. For example, segment errors on the latest release and from a critical section of your application, like errors in your customers' shopping cart.
Build a segment with the release filter set to latest and context:shopping_cart
Relieve the pressure and simply fix what needs to be fixed
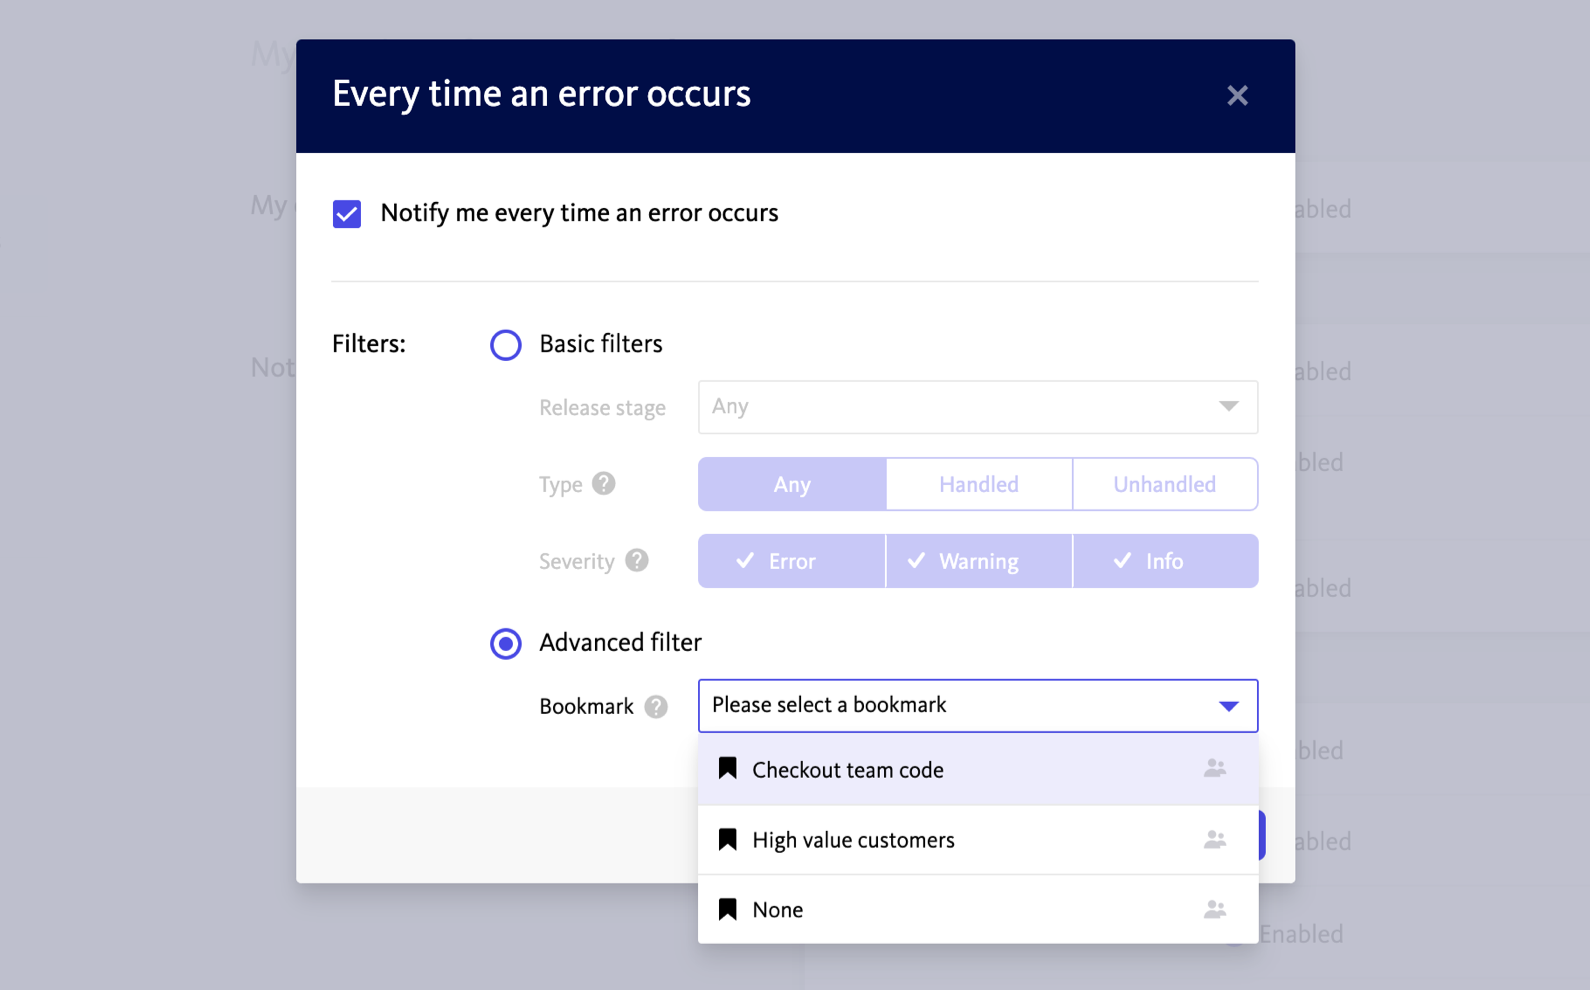
Alerting and Workflow Engine delivers relevant and actionable error alerts
Customize error alerts to be notified of the errors that matter to you, such as those occurring in your codebase, in critical parts of the application, or affecting key customer groups.
Use alerts to drive decisions about error prioritization and resolution, align the team around the bugs that matter, and resolve high impact errors quickly. Additionally, you can streamline debugging workflows with team chat, issue tracker, and incident management integrations.
Ensure team alignment throughout the debugging process
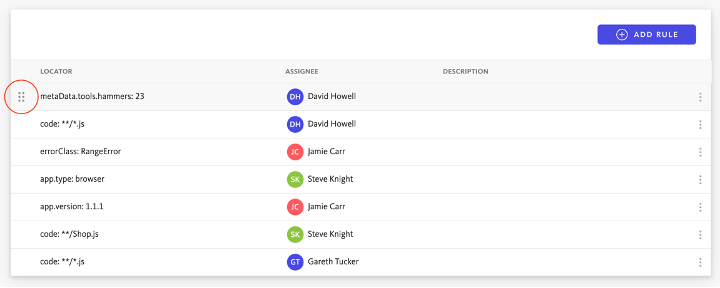
Use assignment rules to ensure errors get passed to the right owner, right away. Automatically assign new errors to a team or collaborator and notify the rule assignee with a notification. Record each error assignment so users can view the list of rules for quick reference.
Order your rules for clear designation on which rules take precedence over others. When priorities change, effortlessly reorder rules with drag-and-drop features and add a description when rules require additional context.
Use breadcrumbs to keep track of what happened and why
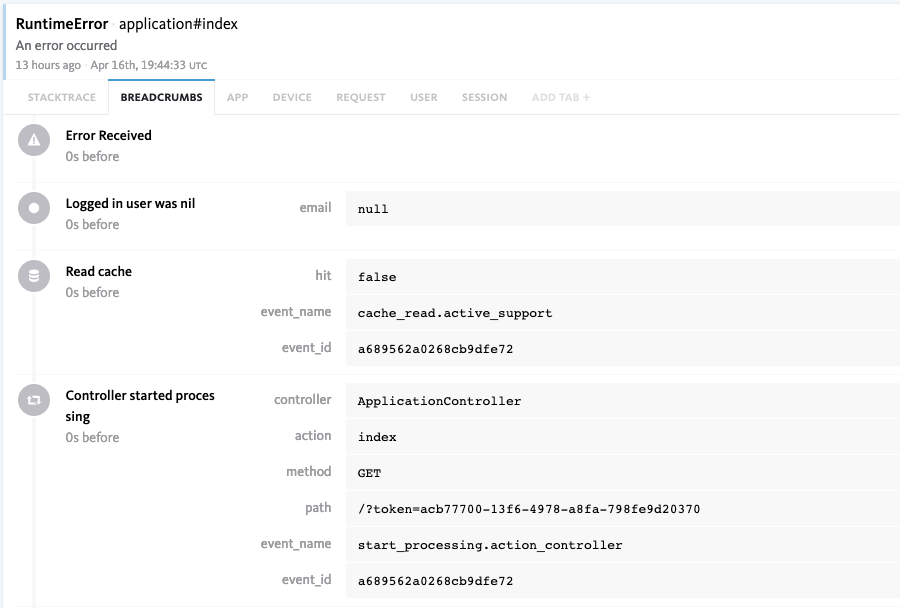
When issues arise, it’s easy to get lost searching for the answers deep within your logs. Breadcrumbs are attached to each error report to show what events led to the issue occurring. You can configure breadcrumbs to log potentially useful events in your application, and attach custom metadata to provide even more insight.
BugSnag's advanced client SDKs give you unrestricted ability to augment, remove or modify all breadcrumbs and metadata
Open source error reporting libraries for over 50 platforms
android:name="com.bugsnag.android.API_KEY"
android:value="your-api-key"/>
<dict>
<key>apiKey</key>
<string>YOUR-API-KEY</string>
</dict>
It's that quick and easy! We support popular mobile and gaming platforms such as Android, iOS, Kotlin, React Native, and Unity, in addition to many other frameworks! Check out the docs for more information.
@bugsnag/plugin-react
import BugsnagPluginReact from '@bugsnag/plugin-react'
apiKey: 'your-api-key',
plugins: [new BugsnagPluginReact()]
})
It's that quick and easy! We support React, Vue, Angular, Ember, and more. Check out the docs for more information.
It's that quick and easy! We support Go, Laravel, Python, Node.js, and .Net. Check out the docs for more information.
