Comprehensive Android crash reporting, stability tracking, and performance monitoring
Add BugSnag to your Android apps to automatically detect unhandled exceptions and performance issues
Maximize your Android app’s performance
Get the insights you need to identify and fix performance issues with screen loads, app starts, network requests, and more
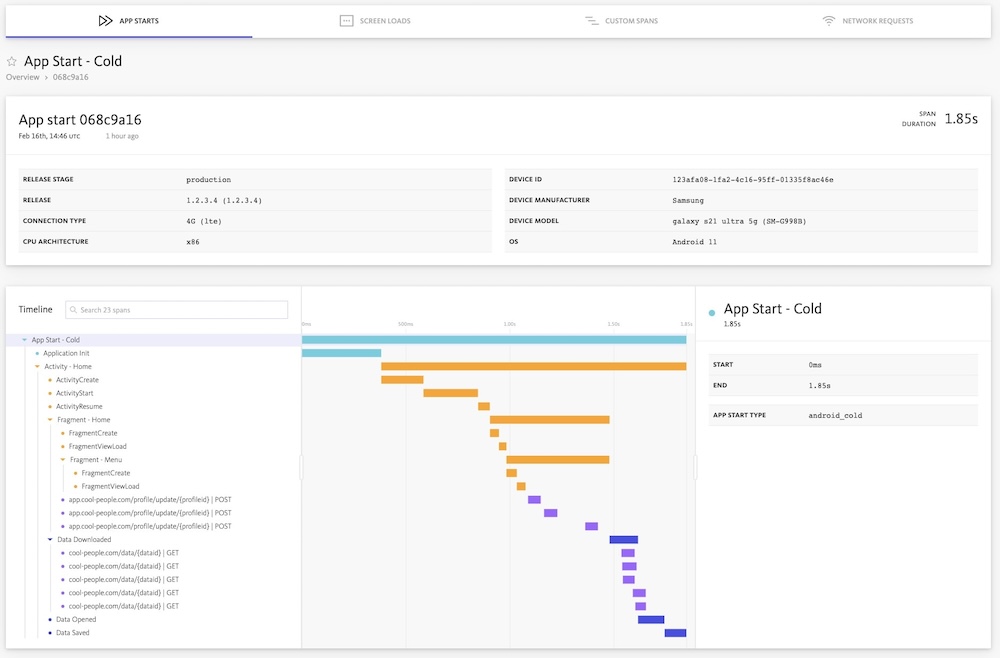
Pinpoint performance problems
Get real-user performance to rapidly identify lags and get the context you need to fix the root cause. Leverage user metadata like OS version and device type to pinpoint exactly what went wrong.
24/7 monitoring of your most vital metrics
Whether its app starts, screen loads, network requests, or custom spans, you need the ability to see application performance as it’s happening. Monitor these key metrics over time to identify performance trends.
Pay for insights, not data
Data is worthless without context. Get all of your cost-effective insights built to scale with your business and control data costs with dynamic sampling and OTel compatibility.
Avoid one-star reviews
Users who have negative experiences using your app can leave negative reviews. Avoid these by making sure your app performance is great and your user experience is flawless.
Identify Android errors and crashes
Automatically captured reports give you the answers you need to pinpoint the source of crashes
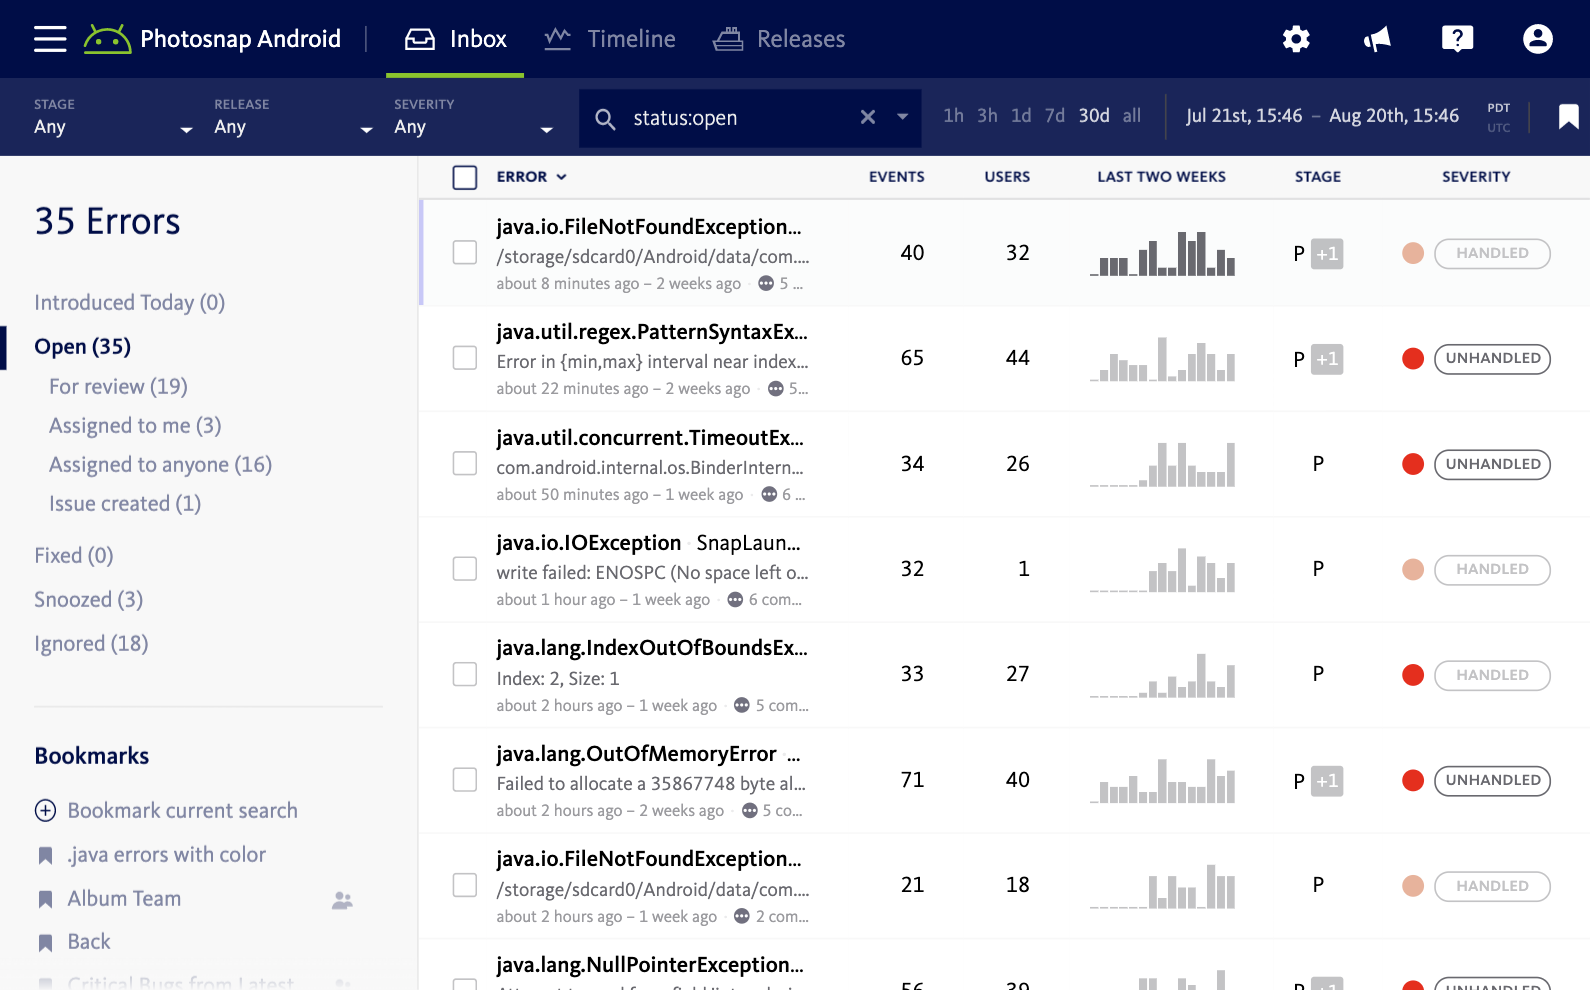
Know when your app crashes
Automatically get alerts when your users see crashes. BugSnag's Android plugin captures unhandled and handled exceptions in real-time. You'll know which crashes happen most and which affect the most users.
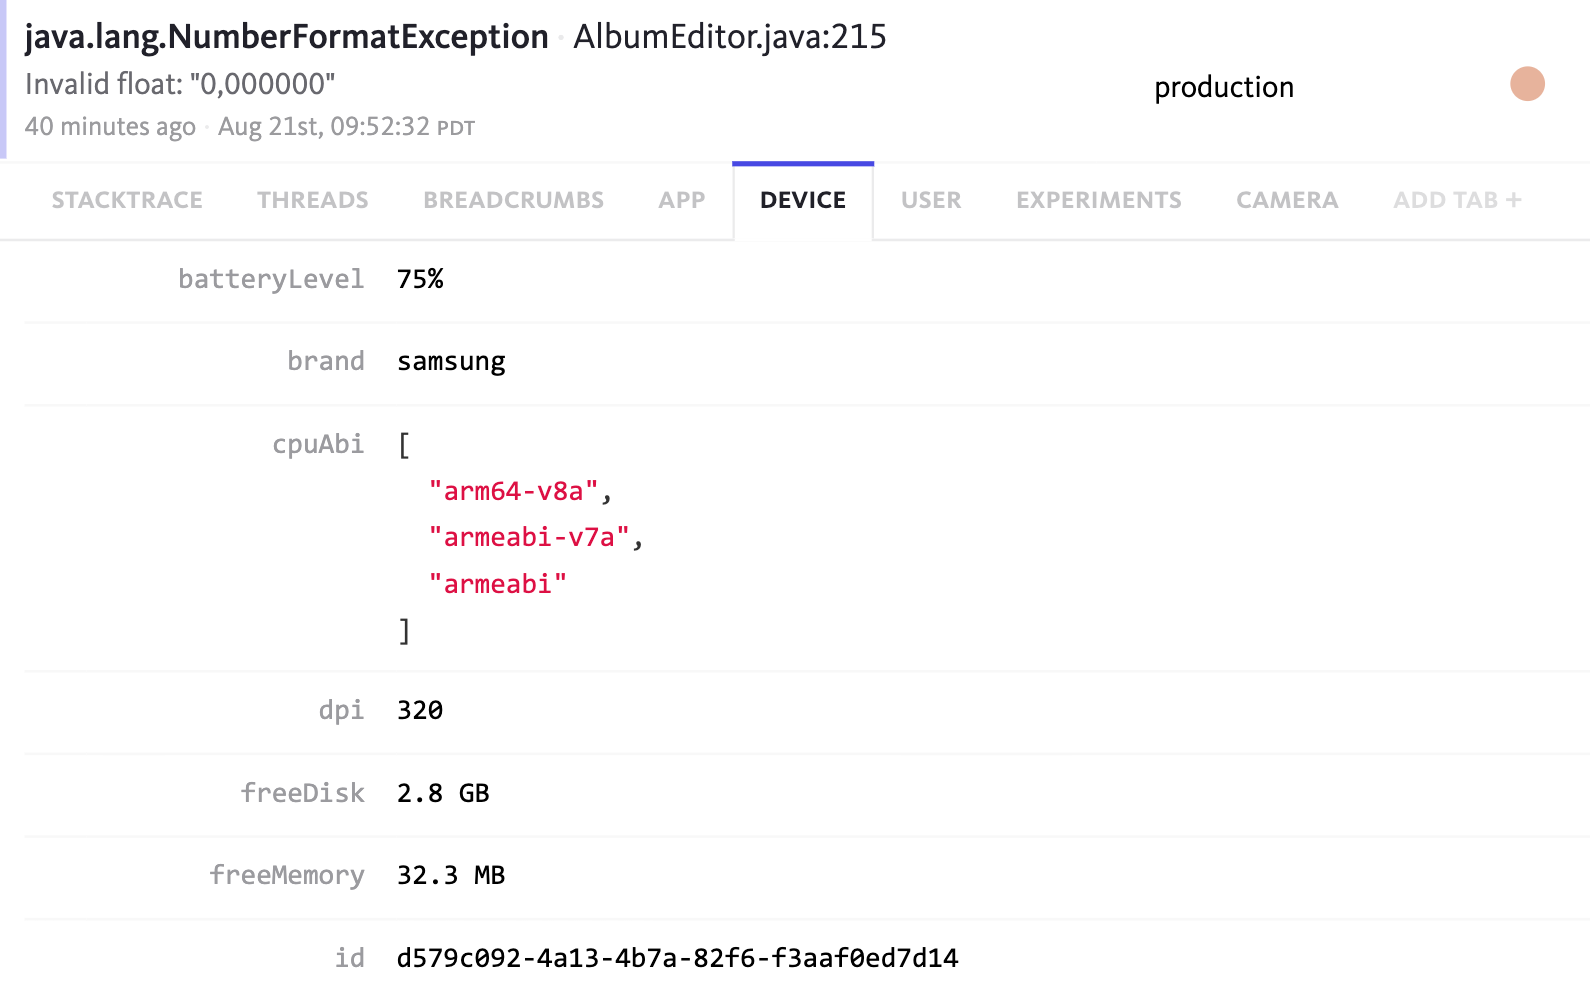
See the state of the device
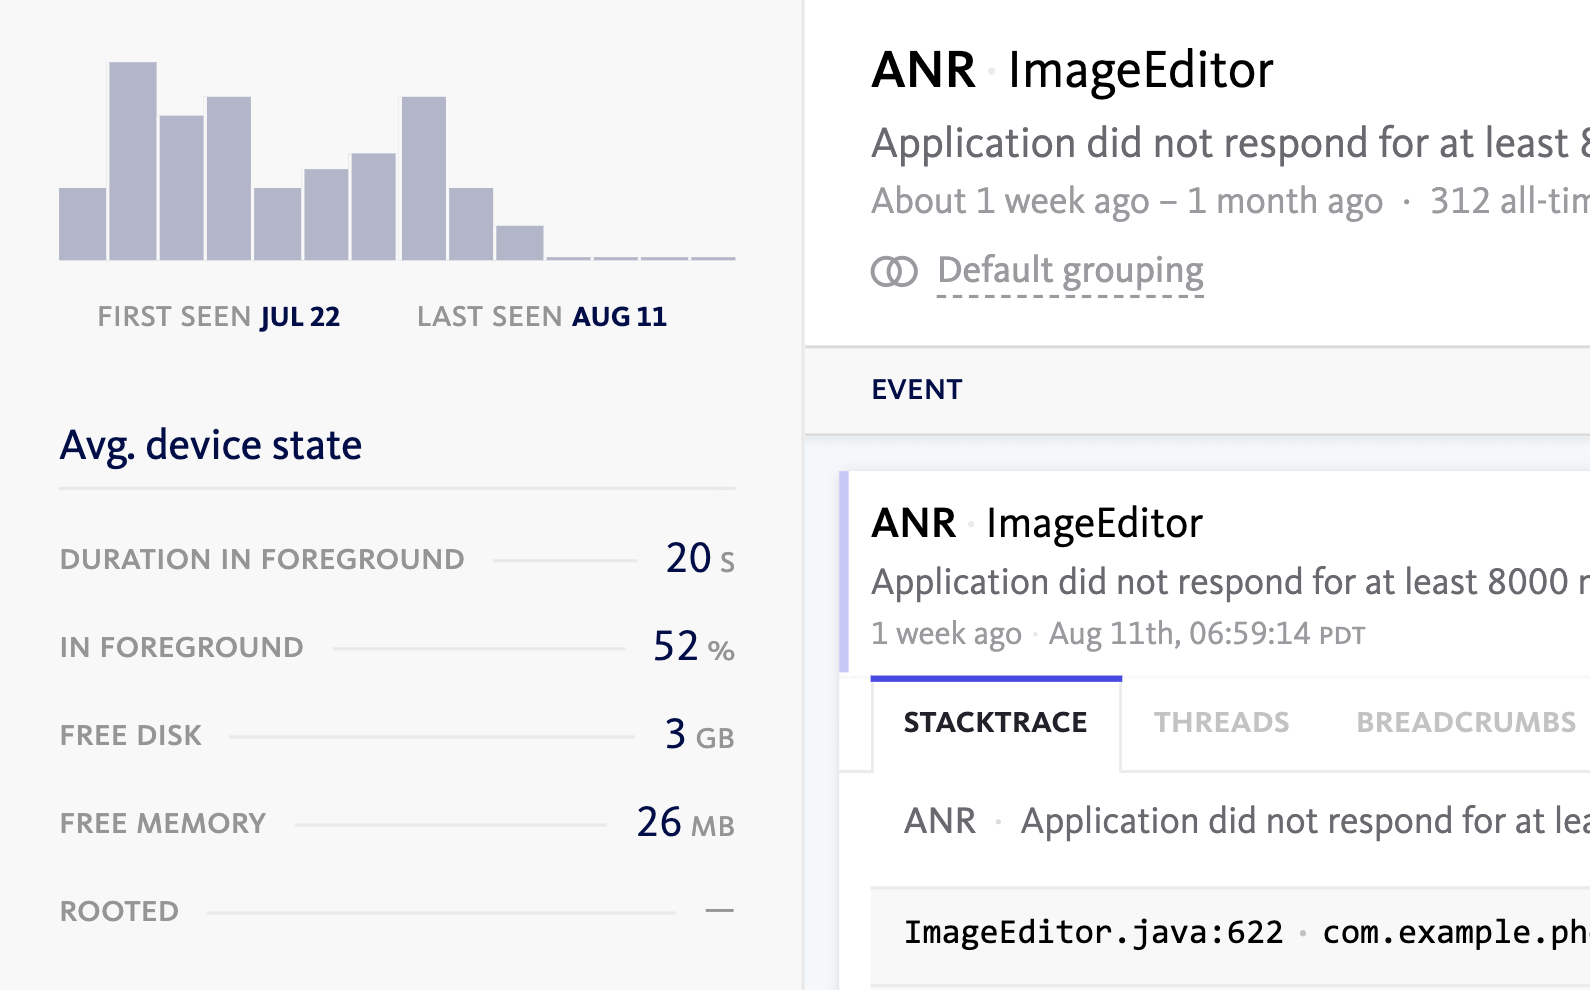
Debugging is more efficient when you know the state a device was in during a crash. BugSnag reports details on memory, hardware features, other apps open, rooted, permissions, battery, and more.
See the code that crashed
See the full de-obfuscated stacktrace for each exception, even full thread state information. If you're using ProGuard, our Gradle plugin uploads your mapping files for each build so you can see the line of code that crashed.
See breadcrumbs
BugSnag automatically captures breadcrumbs, a timeline of navigation events and system broadcasts leading up to the crash being detected. Use them to easily reproduce crashes.
Prioritize and fix Android errors and crashes
After finding key issues, prioritize and fix exceptions impacting your users
Detect and Fix ANRs
Quickly get to the code responsible for Application Not Responding (ANR) errors with a full stack trace. ANRs are grouped by cause, making it easy to prioritize the errors that are happening the most and determine which ones to fix. Read our docs.
Mobile specific diagnostics
Exceptions on mobile require special context, like the screen open when a crash happened and out of memory errors.
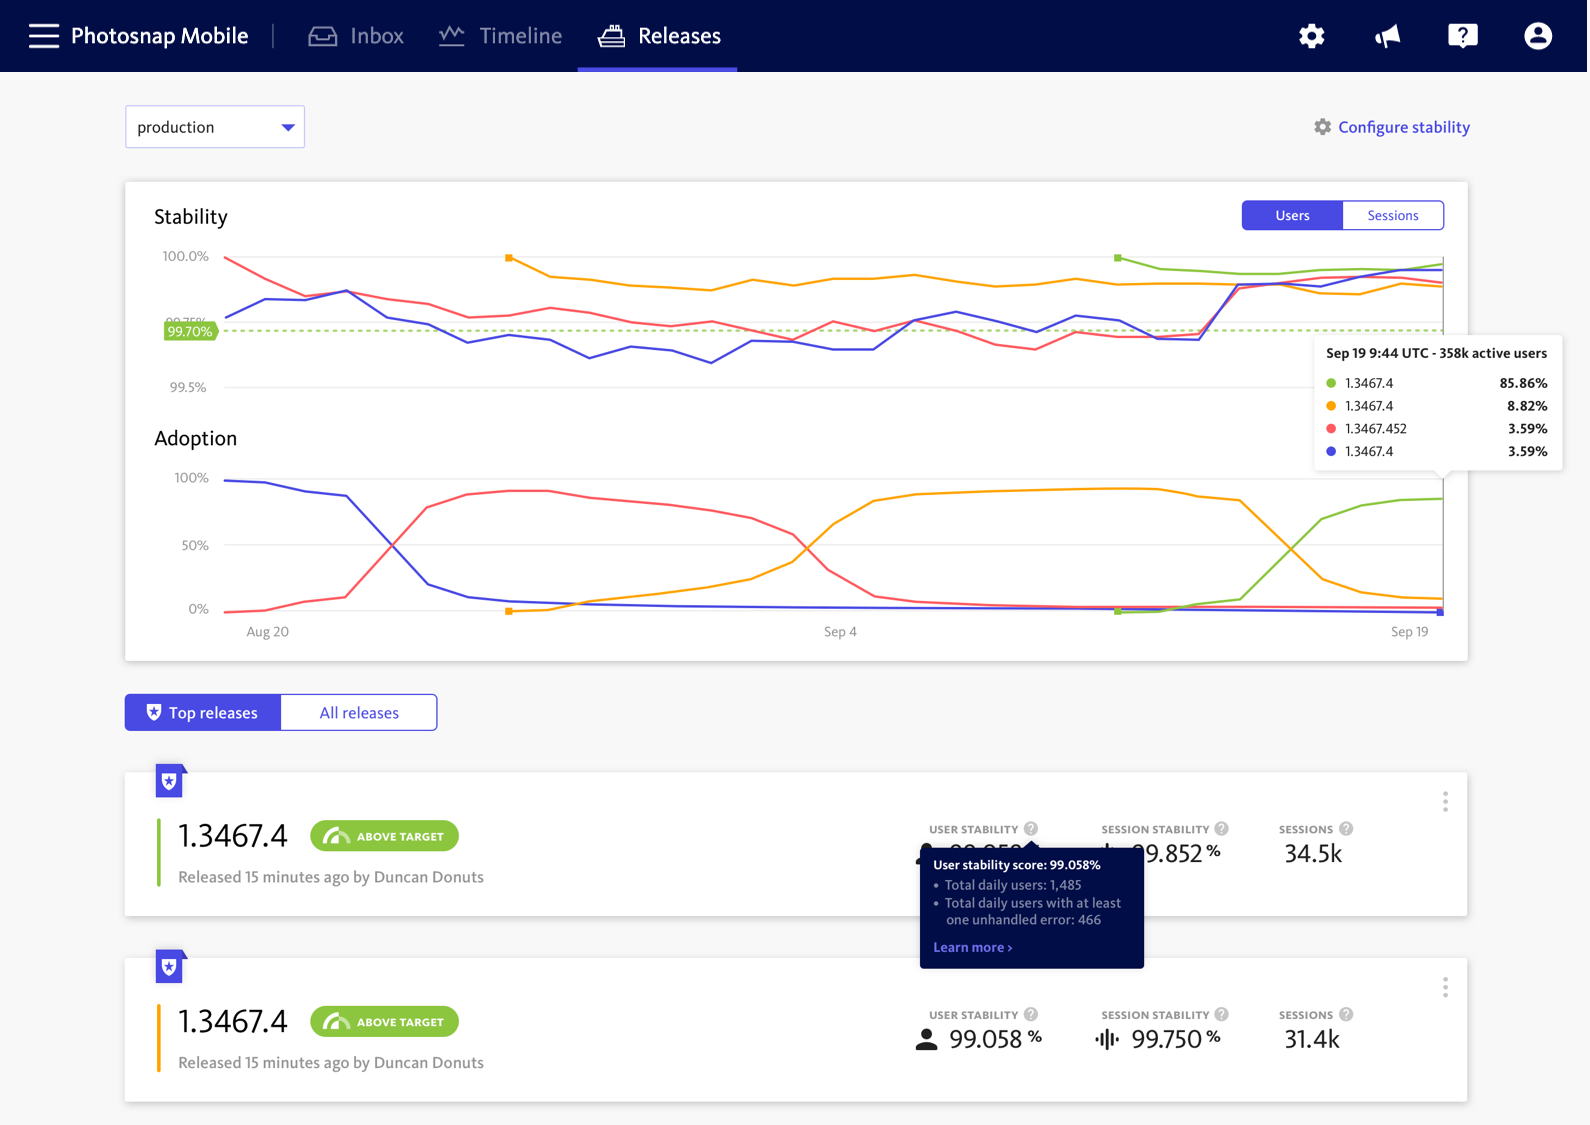
Monitor release health
Use the Releases dashboard to decide if a release is successful or needs to be rolled back. The crash rate indicator shows the percentage of sessions in a release that end in a crash, allowing you to compare release health and track improvements over time.
Android error & performance monitoring for devs, by devs
BugSnag is developer-first - it’s easy to onboard and easy to use
Lightweight library
With less than 800 methods, our Android SDK doesn't add any noticeable overhead to your app loads.
Open source
All BugSnag notifiers are open source so you can see the exception handling code and even make pull requests to suggest improvements.
Enterprise level security
Send errors to our servers using 256-bit SSL, the same encryption used by the world’s leading enterprises. You can host BugSnag on-premise for complete data control.
Support for Android Native Development Kit
Automatically capture crashes in apps written in native code languages with BugSnag support for NDK. A quick install and you'll get info on both the C++ and Java environment, including de-obfuscated stacktraces.
What customers are saying
Stacey Snyder
Sr. Director of Engineering, Recurly

Software Engineer, Chime

Nahuel Barrios
Engineering Manager

Antonio Niñirola
Engineering Manager

