
BugSnag Beginners Series – Error Inbox
Hello and welcome to the BugSnag Beginners Series! This five-part series is going to focus on concepts and features in BugSnag that are fundamental to any user’s experience. So, whether you’re logging into the BugSnag Dashboard for the first time or have already created several projects, this series will help you develop a strong foundation for using BugSnag efficiently and effectively.
Note: If you haven’t created a BugSnag account yet, you can sign up for a free trial by following this link.
Let’s kick things off by talking about one of the most essential pages in BugSnag, the BugSnag Inbox. This page houses all of an apps crash data, and can be used to visualize overall app health within a customizable timeline. The grouping logic built into BugSnag uses the underlying root cause of a crash in order to group exceptions as unique events.This helps minimize noise, as well as identify the most relevant crash data in the Inbox.
BugSnag displays each grouped crash with the error headline, as well as the top stack frame where the crash occurred in the app. Below the headline is the message that was generated with the crash, as well as when the error was last seen, and first introduced. If any users within the BugSnag project commented on the error, or were assigned ownership of the bug, that can be found next to the timestamp.
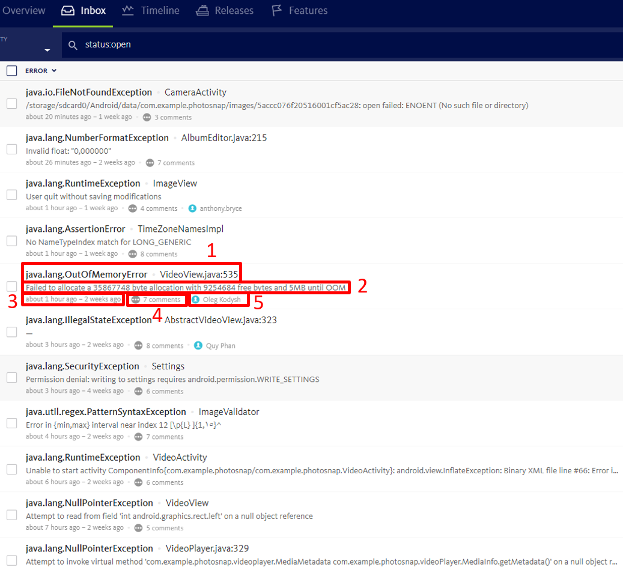
1. Error headline 2. Error message 3. Last time error was seen; First introduced 4. Error comments 5. Error assignee
Error Details
Moving onto the right side of the Inbox, here the crash count of each corresponding error can be found, as well as how many users it has impacted. Clicking these parameters will sort them by total count, starting from largest to smallest. Further right is the trend bar corresponding to each error’s impact within the Inbox’s current time range setting. Adjusting theInbox’s time range can provide insight for up to two months of historical data.Next to the trend bar is the release stage that the error occurred in—BugSnag will display both staging and production builds if the error was seen in both.Lastly, the severity of the error is reflected furthest to the right of theInbox. Unhandled exceptions are by default given an “error” level of severity, and handled exceptions are marked as a “warning”.
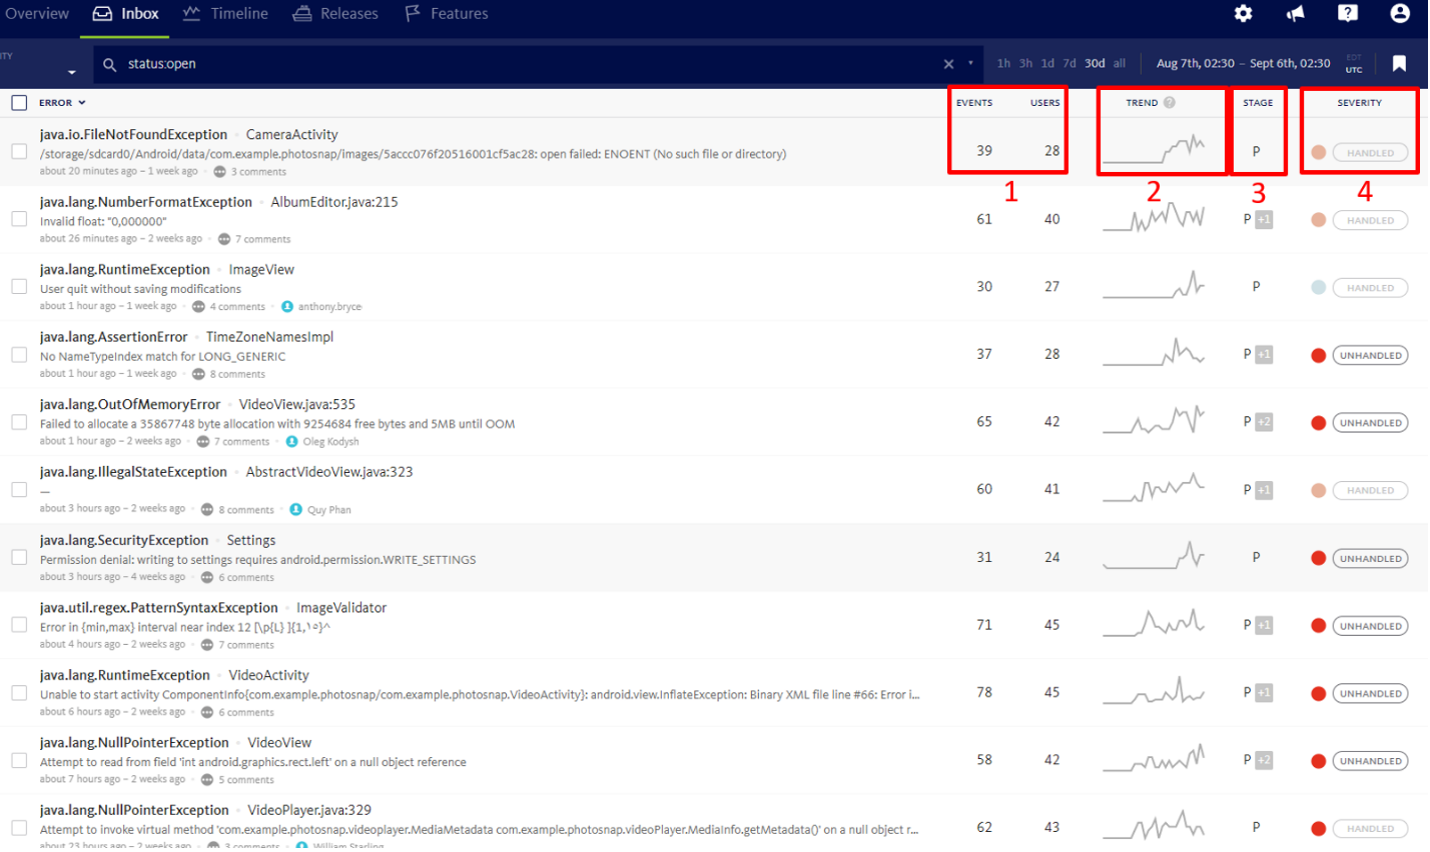
1. Error count 2. Trend bar 3. Release stage 4.Severity level
Error Triage
Lastly, looking to the left side of the Inbox, errors can be assigned to various work status bins to assist in triage. When an errors status is changed, it’s placed in the corresponding status bin. For example, opening an errors status assignment box by clicking the checkmark and then marking the error as fixed, will move it from the “Open” status bin to the “Fixed” bin.Using this workflow will allow team members to know that the error has been actioned, as well as keep the status bins tidy. Errors can also be assigned to various team members using an error “Assigned” status, or via an issue tracker integration such as Jira. Low priority, or noisy errors can be marked as“Snoozed” until they pass a customizable threshold. Lastly, for errors that don’t need to be actioned, marking them as “Ignored” will prevent them from sending notifications. Errors can also be discarded or deleted, removing an instance of the error just once or permanently, depending on the respective action.
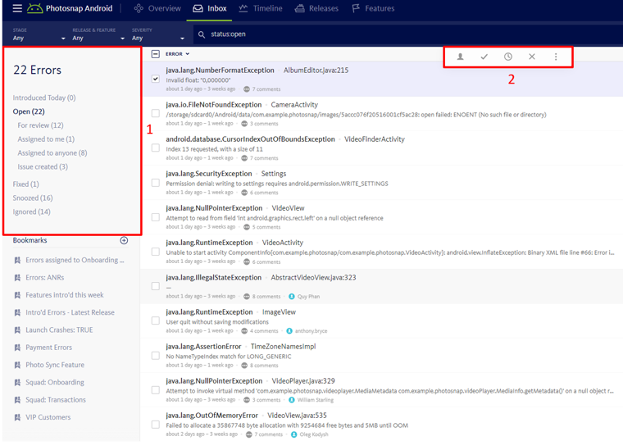
1. Status bins 2. Status assignment box
That concludes the overview of the BugSnag Error Inbox, as well as part one of the BugSnag Beginners Series. Please stay tuned for the next topic, which will be a deep dive into the Error Details page.
See you then!