
How to Optimize Android App Launch Times
User expectations for quick and seamless experiences on mobile applications are higher than ever. One critical aspect that directly influences user satisfaction is the start-up time of an app. The time it takes for an app to launch and become fully interactive can significantly impact the user experience. Slow start-up times may lead to frustration and, in some cases, even prompt users to abandon the app.
Studies have shown a staggering 25% of users abandon an app if it takes more than four seconds to load. In today’s hyper-connected world, where every second counts, these statistics underscore the critical role app start-up times play in shaping user satisfaction and retention.
Types of App Starts
Cold Start: In a cold start, the Android system creates a new process for the app because it’s not already running. This typically happens when the user launches the app for the first time after installation or when the app was terminated by the system. During a cold start, the Android system performs resource-intensive tasks like loading the app’s classes, initializing components, and inflating layouts.
Warm Start: Warm start occurs when the app is already running in the background, and a user relaunches it. In this scenario, some resources may already be cached, and the app might resume more quickly. Warm start-up times benefit from the preservation of certain app states and resources in memory, enabling a faster recovery compared to a cold start. For example, if the user presses the home button and then returns to the app, it’s a warm start.
Hot start: In a hot start, the system brings your activity to the foreground. If all your app’s activities are still resident in memory, then the app can avoid repeating object initialization, layout inflation, and rendering. Hot starts have little optimization opportunities since your app is already running.
The Usual Suspects for Android App Start Time Issues
To optimize app start-up times, it’s critical to identify and address common culprits. The usual suspects include:
- App initialization: The process of setting up components, libraries, and services during app start-up. Optimizing initialization involves prioritizing only essential tasks and deferring non-critical operations. By employing lazy loading, the app can efficiently load only the necessary components during the initial start-up, deferring the activation of non-essential operations until they are genuinely needed. This strategic approach ensures a more streamlined and responsive initialization, contributing to an enhanced user experience, particularly when the app is started up in response to an intent.
- Activity Loading: A critical aspect of Android app performance, it involves loading and inflating UI components – layouts, views and information from databases, network requests, or other sources. Especially in activities with complex layouts, it can contribute to slow start-up times. Employing strategies such as optimizing layout inflation (by flattening the view hierarchy by reducing redundant or nested layouts) and not inflating parts of UI not required during launch minimizes unnecessary overhead. Deferred initialization of resources, careful handling of data loading, and reduction of non-essential dependencies contribute to faster start-up times.
- Custom User Data: This involves loading and/or processing custom user data at the initiation of an application. This could encompass various operations such as executing custom code that might involve time-intensive tasks or retrieving data from databases or memory before the application fully starts. Examples of such operations include verifying user login status, managing feature flags, and restoring user sessions. Optimizing custom data involves efficient handling of user data and user states by loading only essential user data, using caching mechanisms and adapting progressive loading, especially in scenarios involving extensive processing, is crucial.
- Network Calls: Modern apps rely on fetching data from a server or external APIs during initialization and the latency introduced by network requests can cause delays in rendering the app interface. Minimizing the number of network requests, optimizing API responses, and compressing data can reduce the overall data transfer size, thereby speeding up the network calls. Caching mechanisms, both on the client side and utilizing Content Delivery Networks (CDNs), help store and retrieve frequently used resources locally, reducing the need for repeated downloads.
How to Instrument App Start Times
Instrumenting app start times involves strategically placing monitoring points to gather data. Here’s how you can instrument your android app for effective performance monitoring:
- Profiling and Analysis: Utilize profiling tools to identify performance bottlenecks during start-up. These tools can analyze CPU and memory usage, thread activity, and network interactions.
- Custom Instrumentation: Identify critical points in your app’s start-up process (e.g., initialization, network calls, custom data loading and implement custom instrumentation to log performance metrics at these points.
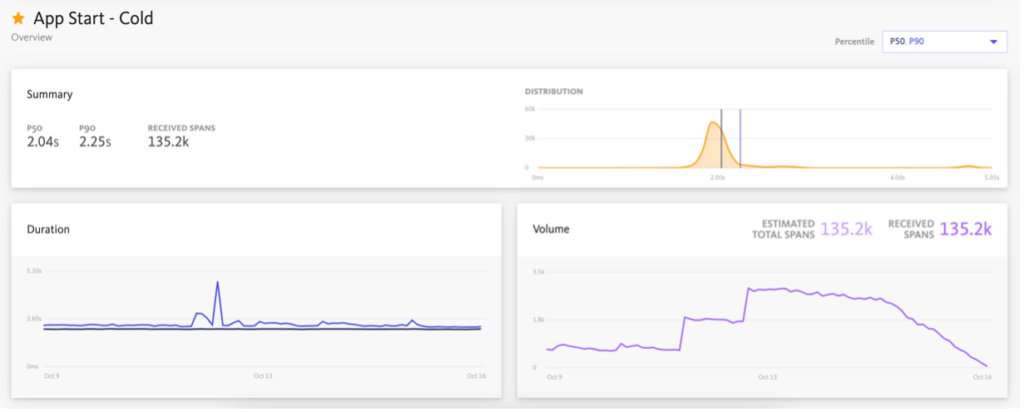
- Use Performance Monitoring Tools: Leverage comprehensive performance monitoring tools, like BugSnag’s real-user monitoring, to gather and analyze data and monitor key metrics such as app start times, network request durations, and custom span timings.
Using BugSnag to Empower Performance Excellence
BugSnag’s real-user monitoring, our performance monitoring solution, is designed to empower developers with insights into their app’s performance. Here’s how BugSnag can assist in optimizing Android app performance including app start-up times:
- Real-time Performance Data: It allows you to monitor the performance of the operations that are important to your users in real-time. OpenTelemetry-compliant trace and span data are collected by our Performance SDKs and sent to BugSnag.
- Effortless Integration: Easy integration which automatically instruments app starts, activity and fragment loads and okhttp network requests.
- Use custom spans: By using custom spans, you gain the ability to instrument and measure the performance of custom code, third-party integrations, or any other operations that might impact the overall performance of your app. You can send custom spans to BugSnag for any other operations you wish to measure, use `BugsnagPerformance.startSpan` to start a span and call the span’s end method to end the measurement.
BugsnagPerformance.startSpan("Login").use
{LoginApi.login()}
In conclusion, optimizing app start-up times is a key aspect of delivering a top-notch user experience. The initial moments when users launch an application significantly influence their perception and satisfaction. With BugSnag’s real-user monitoring capabilities, developers can gain actionable insights, identify performance issues, and ensure their apps perform at their best for end users.