
iOS Performance Monitoring Best Practices
Mobile users expect apps to be fast and responsive. If your app takes a while to load or doesn’t react quickly to user input, users are more likely to get frustrated and uninstall it. Or, if your app makes too many large network requests, it can drain users’ batteries and data plans, leading to bad reviews.
With over a billion iPhone users worldwide, it’s important to make sure your iOS apps are performing well. Let’s look at what you should monitor, how to set benchmarks, what tools to use, and how to leverage results to improve your app’s performance over time.
How Do I Monitor iOS App Performance?
The first step in optimizing performance monitoring for your iOS apps is to decide what metrics you need to track. A good place to start is with Apple’s own requirements and recommendations.
Apple’s iOS watchdog system enforces performance requirements by monitoring launch times and app responsiveness. If an app takes too long to launch or is unresponsive for too long, the watchdog will automatically terminate it on the user’s behalf. However, while Apple’s watchdog system can be helpful in identifying performance issues, it is typically triggered only for extreme situations.
Here are some issues that can trigger a watchdog termination:
- Excessive utilization of memory
- Excessive utilization of CPU leading to overheating
- Blocking the main thread due to synchronous networking
- Blocking the main thread for too long
- Taking too long to complete background tasks
To maintain great application performance, you can implement more preventative measures – for example, you can proactively improve your app’s performance by following Apple’s recommendations for these areas:
- Launch time: Decreasing launch time improves user experience, retention rates and reduces the chances of termination.
- Memory usage: Decreasing overall memory usage improves responsiveness when users switch back to your app.
- Disk writes: Reducing disk writes improves app performance and responsiveness.
- Error rates: Reducing error rates improves the user’s perception of your app’s performance, responsiveness, and overall quality.
- Battery consumption: Reducing battery consumption and power-hungry processes improves the overall user experience.
Setting the Right Benchmarks
Suppose you’re working hard to collect performance data and improve your iOS application performance. The next step is to go beyond the minimum requirements and create benchmarks to ensure your app not only meets, but also exceeds users’ high expectations.
Some starting points for measuring application performance include:
- Launch Times: The top 40% of apps launch in under two seconds, and the top 70% launch in under three seconds. You should target a launch time of 1.5 to 2 seconds to meet or exceed user expectations.
- Network requests: Apps should respond to user requests within one second, which includes network requests to APIs. If a request takes longer, show (acceptably) stale data or a loading indicator.
- Responsiveness: Apps should respond to user gestures or input within 250ms. If it takes longer or there’s an error, it’s considered a UI hang that may trigger a watchdog termination or, at the very least, result in a negative user impression.
Ultimately, your specific benchmarks depend on your target users’ requirements and expectations.
Finding the Right Tools
Apple’s low-level performance optimization tools are great, but they don’t always catch issues users experience in the real world. For example, you might miss an edge case that only affects a small subset of your users, leading to degraded performance and poor user experience.
BugSnag’s real user monitoring (RUM) can help you surface performance issues and give you the information you need to diagnose and fix them quickly.
Here are some of the benefits of using BugSnag:
- Real user data: BugSnag’s 24/7 RUM gives you visibility into critical performance metrics like warm and cold app starts, network requests, and screen-load time. This means you can address slow performance issues before they impact more users.
- Search and segmentation: Use BugSnag’s filters to monitor performance in crucial areas of your app and segment your user performance data based on development priorities. You can also sort and filter spans by multiple attributes in your table view and drill down into specific instances to see the full trace and gain insights into what’s causing slow performance.
- Custom dashboards: Star your most popular app screens, page loads, and network requests to the top of your dashboard. This means you can easily identify and address the issues that matter most to your users and your application. You can also add unlimited custom spans to personalize your insights to your section of the codebase.
In addition to RUM, BugSnag also offers robust error monitoring and app stability management features:
- Stability Score: BugSnag’s Stability Score provides an easy-to-use metric to help your team decide between building new features or troubleshooting bugs. You can also use the Stability Score to benchmark releases and decide if a new release is successful or requires a rollback.
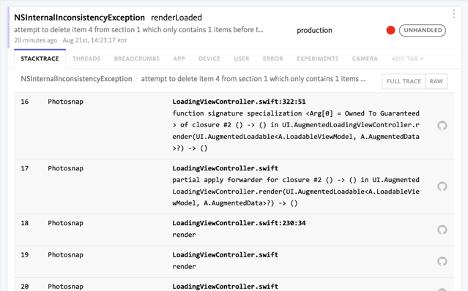
- Crash reporting: BugSnag automatically detects crashes in your iOS app and provides a full, symbolicated, stack trace with each bug report. This means your developers know the exact method name and line that caused the crash. You’ll also have access to the device model, OS version, battery state, thread state, and more to help debug. This is in addition to also having the breadcrumbs show you what led up to the crash.
- Sorting and filtering: BugSnag automatically prioritizes errors, enabling your team to focus on bugs with the most significant impact. You can also filter and sort bugs by various criteria, such as the app version, user-reported bugs, or event counts. You can even configure notifications based on specific criteria to alert the right team members and avoid notification fatigue.
Overall, BugSnag is a powerful tool that can help you improve the performance and stability of your iOS app.
Plus, BugSnag is a lightweight dependency. You can install the package using Cocoapods or the Swift Package Manager in a couple of lines of code. After adding your API key in Info.plist, you can start collecting data by inserting BugsnagPerformance.start() in your App Delegate. If you want to customize further, check out the iOS Integration Guide.
The Bottom Line
Performance can make or break an app, and optimization is a never-ending task. Every new feature or code change can potentially slow down your application. That’s why it’s important to test performance metrics during development and to monitor real user application performance in production. By following the iOS performance monitoring guidelines mentioned above, you can maximize your app’s performance and improve its competitiveness in the app store and the broader user experience.
Start your free BugSnag trial today, or request a demo to learn more!