
Mastering Android Performance Monitoring: Metrics, Tools & Strategies
Android is the most popular operating system in the world, with over 2.5 billion active users across over 190 countries. As a result, the Android ecosystem consists of more than 3.5 million apps – more than double the 1.6 million apps available on iOS. This means fast and seamless app performance has become critical for success.
This article looks at what performance metrics to monitor, the strategies you can use to ensure a high-quality user experience, and how to minimize customer frustration and churn.
What to Monitor
The first step in Android performance monitoring is choosing what metrics to watch – but with so many options, it can be challenging. If you don’t choose enough metrics, you might miss an impactful part of the user experience. But if you measure everything under the sun, you’ll struggle to separate the signal from the noise and suffer from analysis paralysis.
The key is choosing the most impactful metrics for your app. After all, if you have a mobile game, frame rendering times and input responsiveness may be far more important than network usage or app startup time. But if you have a social media app, app startup time and network usage may be essential to keeping users engaged. There’s no single answer for each app.
Some metrics to consider monitoring include:
- Startup time – How long does it take your app to startup from click to responsiveness?
- Stability – How many crashes do you experience per user or session?
- Memory usage – How much memory does your app use (max and on average)?
- CPU usage – How much CPU does your app use (max and on average)?
- Battery consumption – Does your app require a lot of energy?
- Network performance – Are your external APIs fast and responsive?
- Disk usage – How much space does your app require on a device?
- Frame rendering time – How many frames can you render per second?
- UI transition speeds – How responsive does the app feel when flipping through screens?
- Input responsiveness – How responsive does the app feel when entering data?
- Logic execution speeds – Do you have complex logic that takes time to process?
Startup Time
App startup times influence a user’s perception of performance. It won’t matter how excellent the rest of your site or product is, if users have trouble loading the first page, they won’t stick around. Startup time is a metric that must be optimized before seeing your site’s full potential.
As a rule, you should target an app launch time of less than two seconds. If you’re beyond that threshold, look at your site more deeply. It may be as simple as your media files are too large, and you need to resize them. You can use techniques like lazy-loading data or running updates in the background to launch network-intensive apps sooner without compromising the user experience.
Network Performance
Network requests play an enormous role in app speed and responsiveness. Unfortunately, Android performance monitoring involves considering both the external service and the user’s network connection. So, while you want to keep a close eye on this metric, you must remember that sometimes there’s just nothing you can do to improve it.
Generally, you should target a one-second response to any user requests, even if it’s showing a loading screen as data trickles in on a 3G connection. Optimize your network performance as much as possible, but you should also prepare to explain this fact to displeased users.
Choosing Tools
Most Android performance monitoring efforts start with the Android Profiler – a built-in tool that provides real-time statistics to help understand how Android apps use device resources. The tool includes CPU, memory, and energy profilers to diagnose many of the most common performance issues.
While the Android Profiler is a great start, BugSnag offers a much more robust and developer-friendly platform for identifying and prioritizing performance issues. After adding a lightweight dependency, you’ll have access to real user monitoring (RUM) data you can use to make more informed performance optimizations.
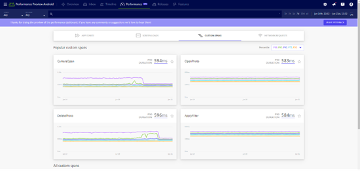
With BugSnag, you can keep tabs on the most important functions of your app where your users expect high performance. Our performance dashboard has dedicated tabs for operations like app starts, screen and page loads, and network requests so you can proactively identify slow performance before your team is overwhelmed with user complaints. You can also monitor any operation in your app by adding custom spans so your whole app is covered.
The Bottom Line
The Android app ecosystem represents the world’s largest collection of applications, meaning your app faces more competition than anywhere else. As a result, Android performance monitoring is critical to ensure a high-quality user experience and avoid costly one-star reviews from slow app starts, laggy page loads, or other performance issues.
If you want to improve your app performance, start your free BugSnag trial and see how easy it is to collect real user data, track down performance issues, and quickly resolve them.