
How can server-side breadcrumbs stop debugging headaches?
For server-side issues there’s an expectation that logs should be used for everything, including tracking incoming requests, the actions taken during those requests, and any jobs scheduled to run. With the recent addition of server-side breadcrumbs to our Ruby notifier all these events can be automatically tracked from the beginning of a request through to the moment an error occurs, with full control over what data is collected to make debugging easier than ever.
What are breadcrumbs?
When debugging we take on the role of a detective and breadcrumbs can be thought of as clues to lead us to the error-causing culprit. Each clue has characteristics that help us to get closer to the root cause: what is the size of that glove, how long ago was that window broken, where does the footprint lead to?
Breadcrumbs are no different. Each one marks a distinct point in the application where a significant event occurred. These shouldn’t be lines of code, that’s what stack-traces are for, but actions that have occurred in the same context of an error that might otherwise go unnoticed. Knowing that a particular button was previously pressed, or that an important database transaction failed, can be essential to finding the root cause of an error, and not immediately obvious when looking at a stack-trace.
In Bugsnag we can find breadcrumbs inside of the error report in our dashboard:
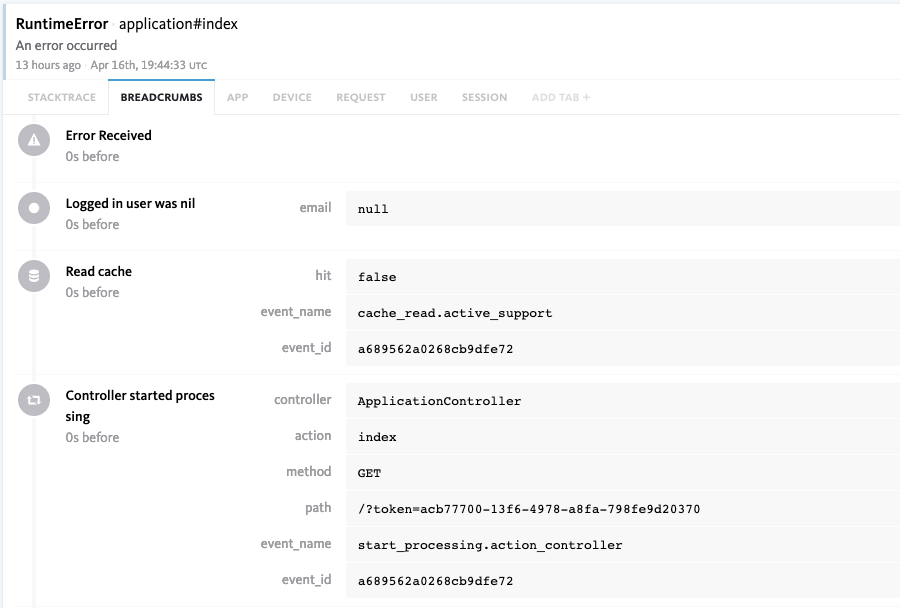
These demonstrate some of the main features of breadcrumbs:
- A category, as shown by the icon to the left of the breadcrumb
- A time-to-error, telling us how close to the error the breadcrumb was logged
- A name, letting us know why the breadcrumb was logged
- Some meta data, which is optional but can give import information for diagnosing issues
Breadcrumb categories
In Bugsnag-ruby breadcrumbs are split into different categories that cover different actions that can occur inside of an application. This makes it easier to tell what is happening in our application at a glance:
Error breadcrumbs
- Previous non-fatal errors that occurred earlier on the same thread
- Whether a chain of errors, fatal or non-fatal, are occurring one after the other
Manual breadcrumbs
- Custom breadcrumbs that we can add at any point
- Anything! We can use these when we think there’s any significant activity that we want noted in any subsequent error reports
Navigation breadcrumbs
- Triggered by a navigation from one page to another
- Allows us to track user movement from page to page in client-focussed contexts
Request breadcrumbs
- The server or application received an HTTP request
- These breadcrumbs will track an incoming request and any request processing or rendering performed
Process breadcrumbs
- Created when a secondary task or process, such as a job, database, or cache request is started or finished
- These will help us to figure out where interactions with other parts of our app could be leading to unexpected errors
Log breadcrumbs
- A record of when a message is logged from the application
- Gives us a record of logged messages, whether from within the application or a framework
User breadcrumbs
- When the user interacts with the application
- These allow us to track the users actions up until the error took place
State breadcrumbs
- A record of any state changes that occur in our application
- Typically client-focussed, these will help us to determine the state of the application at the time of the error
These categories not only will allow us to determine why a particular breadcrumb has been attached, but can also be used to filter out breadcrumbs that we don’t want to capture, which we’ll discuss later on.
Client-side breadcrumbs
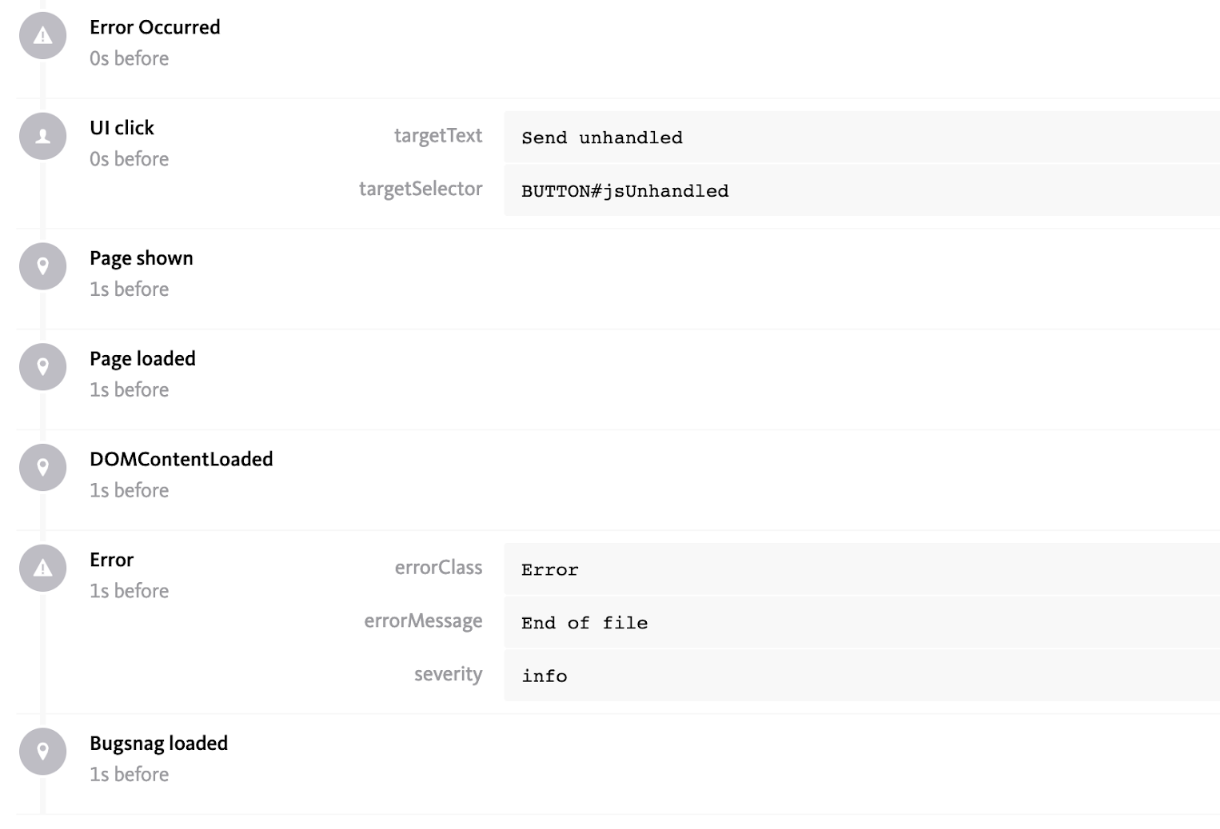
These breadcrumbs typically record user interactions and changing states for an application. A good example might be recording when a user selects an option, or when the browser loses network connectivity, or if the application is minimized to the background of the operating system.
As an example, here’s what some client-side breadcrumbs could look like:
Server-side breadcrumbs
For server side breadcrumbs the information we capture is less obvious, as users don’t typically interact directly with a server, we shouldn’t have access to the operating system to check for changing network states or to note when an HTTP request is made, and for performance reasons we don’t want to be constantly monitoring server status.
We can however hook into various points of the frameworks we support, allowing us to generate breadcrumbs from events that framework notifies us about. In this environment we would start with covering the following events:
- Receiving a request and the response
- Reading data from a database or cache
- Starting a background job and noting the result
To achieve this in our Ruby notifier we can hook into the popular server-framework, Rails. Since the Rails 3 release in 2010, the ActiveSupportmodule has offered instrumentation, allowing hooks to be added to specific events in other Rails modules such as ActiveRecord. We can then use this functionality to automatically generate useful breadcrumbs to aid in our debugging. and ActiveJob
The Bugsnag-ruby notifier automatically adds the necessary event hooks to generate the breadcrumbs using the ActiveSupport::Notifications.subscribe method, so there’s no additional setup necessary. In addition the event will attach some common and some event specific data to the breadcrumb, giving us even more useful data to work with when debugging.
While the majority of automatic breadcrumbs are acquired using the ActiveSupport module, Bugsnag-ruby also automatically hooks into the MongoDB monitoring api, ensuring database events are breadcrumbed automatically just like with ActiveRecord and letting us use the database of our choice.
Finally, the server-side breadcrumbs the Ruby notifier collects are limited by two things:
- The breadcrumb count, defaulting to 25, prevents memory issues from collecting too much breadcrumb data at any one time. As new breadcrumbs are collected that exceed this limit, the oldest breadcrumbs will be removed.
- It’s possible to override this default setting using the max_breadcrumbs configuration option, if more breadcrumbs are desired.
- The Rack framework and all the server frameworks built upon it, including Rails, use threads as a way to manage incoming requests. Likewise the breadcrumbs collected by Bugsnag are thread-based, to ensure breadcrumbs generated by one request don’t show up in an error report from another. This means that interactions between threads will not be identifiable using breadcrumbs, something we need to be aware of while debugging.
Automatic server-side breadcrumbs
Bugsnag have already identified a number of different categories for breadcrumbs that bring value, aiding in debugging an application. Various different events that fit into these categories are automatically captured and attached to any bug reports that occur within the same context as the triggering event.
Here’s an example of some breadcrumbs we may see leading up to an error in our Rails application and by breaking these breadcrumbs down we can see why each was recorded prior to the error occurring:
1. An incoming request
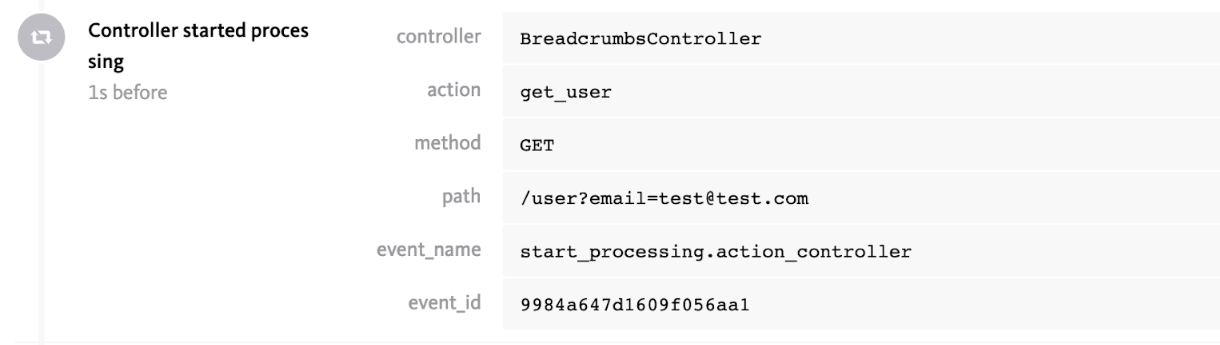
This demonstrates the beginning of the activity on the thread: when the server receives the incoming request. It shows us the path the request came in on, the controller being used to process the request, and the method being called. If our error occurs in the context of this controller, we may already know this information. For middleware, utilities, or other shared code this gives us this additional information at a glance.
2. The database calls
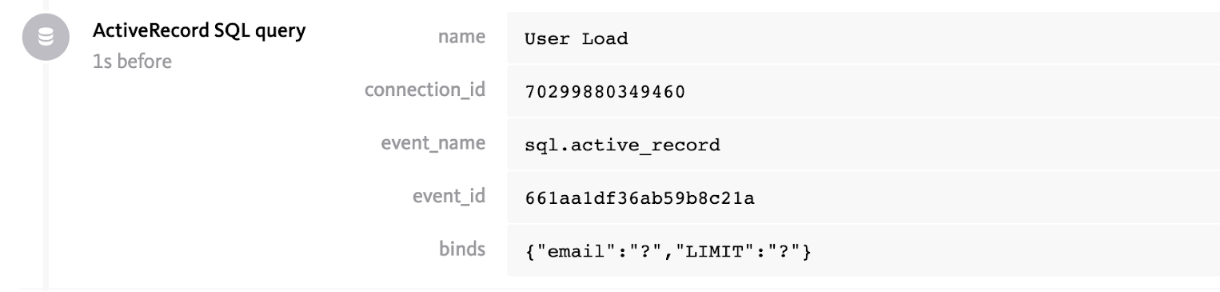
This breadcrumb shows an important part of the process of this request: that a database call was made. From it we can see the command that was called, the database it was called against, how long the call took, the name of the collection the query was made against, and a sanitized list of filters that were attached to the query.
This could help us to figure out if there’s an issue with the database, connection, or query being made. As it shows a failed database call, it also provides useful context to the error that we’re seeing.
3. The previous error
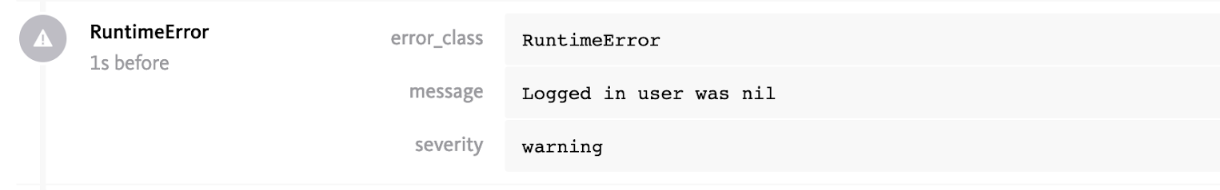
Finally, we have an error breadcrumb, referencing a previous error that was delivered to Bugsnag. This shows that we attempted to handle the unexpected failure of our database, and part of that was notifying Bugsnag. We can refer to this error and see if it provides and clues as to why our current error occurred.
Controlling automatic breadcrumbs
There may be situations where we don’t want breadcrumbs to be tracked. Perhaps we’re not finding the information valuable, or maybe it’s unnecessary overhead to our application that we don’t want. That’s fine, we can disable automatically collect breadcrumbs through our configuration.
We can disable all breadcrumbs:
Bugsnag.configure do |config|
  # Our configuration goes here!
  # We don't want to automatically capture any breadcrumbs!
  config.enabled_automatic_breadcrumb_types = []
end
Or choose only the breadcrumb types we wish to enable:
Bugsnag.configure do |config|
  # Our configuration goes here!
  # We only want to allow automatic error breadcrumbs!
  config.enabled_automatic_breadcrumb_types = [
    ERROR_BREADCRUMB_TYPE
  ]
end
We can even assess breadcrumbs on a case by case basis before deciding whether to include them in our error reports. We can achieve this using the before_breadcrumb_callbacks configuration option, where we get full access to the breadcrumb before it’s ever recorded, allowing us to add and remove data, change the name or type of the breadcrumb to something of our liking, or simply set the breadcrumb to be ignored and never sent to the Bugsnag dashboard.
If we decide we’re not interested in template render events, such as render_template.action_view or render_partial.action_view, we can easily filter out those particular breadcrumbs like so:
Bugsnag.configure do |config|
  # Our configuration goes here!
  config.before_breadcrumb_callbacks << Proc.new do |breadcrumb|
    ignored_breadcrumb_ids = ['render_template.action_view', 'render_partial.action_view']
    breadcrumb.ignore! if breadcrumb.meta_data[:event_name] && ignored_breadcrumb_ids.include(breadcrumb.meta_data[:event_name])
  end
end
There are many ways to control the automatic breadcrumbs that will be delivered with our error reports, but what generates a breadcrumb isn’t limited to what Bugsnag automatically collects.
Customizing breadcrumbs
We aren’t limited to using our automatically generated breadcrumbs, at any point in our application we can call Bugsnag.leave_breadcrumb with a name that’ll help us debug and it will automatically be added to the subsequent error reports. For instance, if we wanted to know whenever we’d called a third party service we could add:
Bugsnag.leave_breadcrumb("Called 3rd party service", {
    :service => "SomeAuthService",
    :url => "https://someAuthService.com/api/v1/auth_me"
})
Which will show up on the dashboard as:
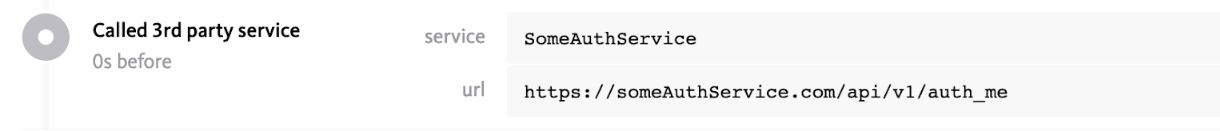
As we can see, we can add our own names and data to a breadcrumb in order to help us track down exactly what is happening in our app, and this can be extremely useful in tailoring Bugsnag to our particular application.
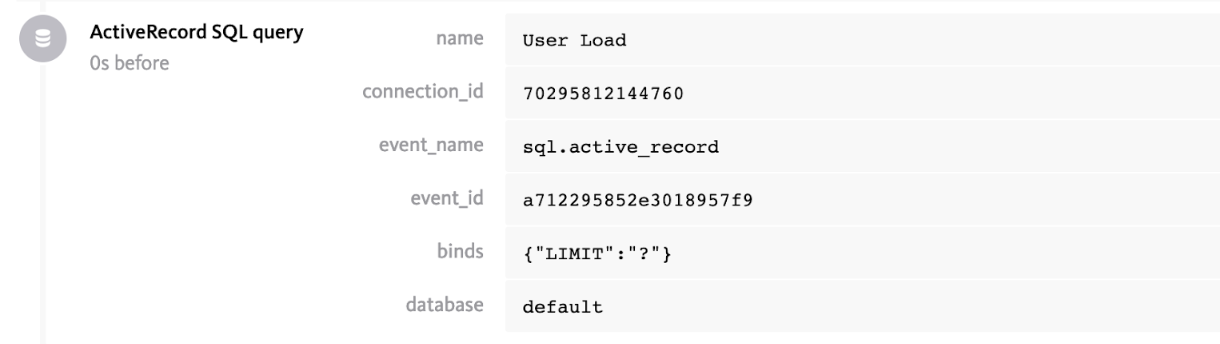
It can also be very useful to attach extra data to a breadcrumb, giving even more information to work with when it comes to debugging. The best part is, we can even do this to automatically created breadcrumb:
Bugsnag.configure do |config|
  # Our configuration goes here!
  config.before_breadcrumb_callbacks << Proc.new do |breadcrumb|
    # It's useful to have some information about the database for breadcrumbs, so lets add it here!
    if breadcrumb.meta_data[:event_name] && breadcrumb.meta_data[:event_name] == 'sql.active_record'
      breadcrumb.meta_data[:database] = get_database_name
    end
  end
end
Which on the dashboard will look like:
As the meta_data property is a hash, we can freely alter the metadata attached to each breadcrumb using before_breadcrumb_callbacks. This allows us to add any data we want, or to remove any data we don’t want to send to the Bugsnag dashboard. There are limitations: the data added must be simple, like a string, integer, or boolean, to avoid getting bloated breadcrumbs that we won’t find useful.
Data in a breadcrumb is also subject to the meta_data_filters like other metadata collected by Bugsnag, so we can prevent specific data from being collected using our configuration.
Where can we use these breadcrumbs?
Several of the notifier libraries provided by Bugsnag support the usage of breadcrumbs. For server side platforms, these include:
There are several more notifiers that contain client-side breadcrumbs. These include:
They all collect different data, so be sure to check the documentation to see exactly what is collected and how we can add to it, or filter it.