
Distributed Tracing: What is it & What are the Benefits?
As a modern software engineer, you’ve likely witnessed the transformative power of microservices. These nimble, independent components have accelerated development but have also introduced a new set of challenges, particularly in diagnosing issues and maintaining visibility across a complex system.
In the past, during the era of monolithic applications, software development was a slow, methodical process. Code changes were infrequent, deployments were tracked meticulously, and monitoring focused on a single, cohesive application.
However, the advent of microservices has ushered in an era of rapid development, scalability, and innovation. With microservices, developers can push out new versions every few weeks, and services scale independently to meet demand.
But along with this agility came complexity. As microservices became more prevalent, a pressing question arose: How do we pinpoint the root causes of issues within this intricate web of services? Traditional solutions like metrics and logs, while still valuable, struggled to provide the complete picture.
This is where distributed tracing steps in to bridge the gap.
What is Distributed Tracing?
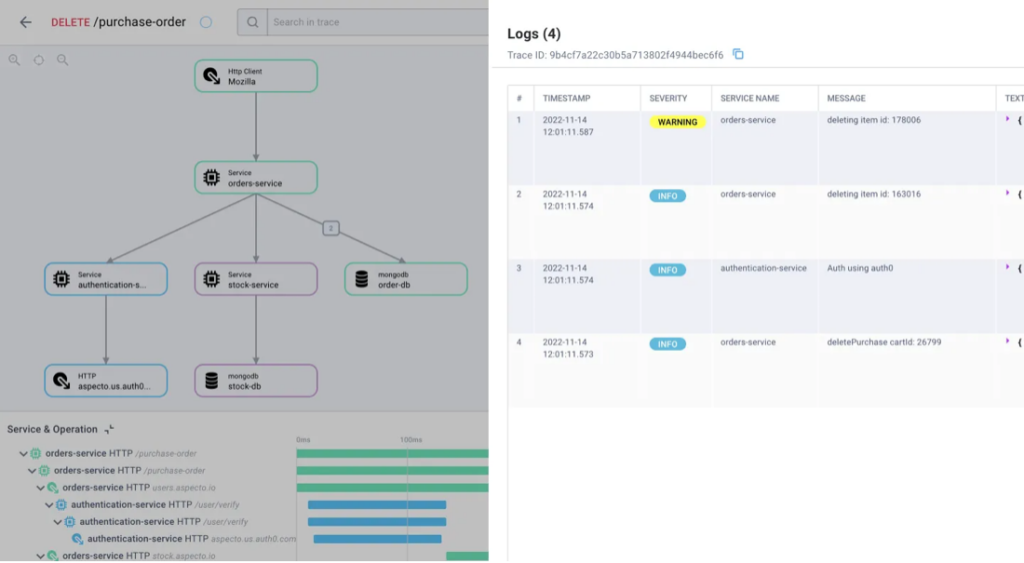
Distributed tracing is a way to track how requests traverse through your system, end to end. It tracks which services a request interacts with, how data flows between these services, and records any errors encountered along the way.
In distributed systems, requests span multiple services that can exist in various environments, from containers to cloud infrastructures. This complexity often leads to performance challenges and makes root-cause analysis a daunting task. Distributed tracing is the remedy.
Think of traces as detailed call stacks for microservices. They help you gauge the duration of each request, the components and services it engages with, and the latency introduced at each step.
By delving into tracing data, engineers gain invaluable insights into request journeys, service relationships, and potential bottlenecks. This newfound visibility empowers them to not only identify and resolve issues but also to optimize system operations.
How Distributed Tracing Works
In distributed software architecture, requests trigger various operations within services. These operations can range from HTTP requests to database queries and more. Typically, a single request initiates multiple actions across numerous services, collectively forming a user’s journey.
A trace consolidates information from all the actions stemming from a single request, placing them in the correct chronological order. These actions are referred to as spans. Spans that precede others are known as “parent spans,” with those following called “child spans.”
To correlate and track requests, each action is assigned a trace ID. All operations originating from the same request share the same initial ID, along with a unique identifier. The data collected about each operation includes the names and addresses of the involved services, start and end timestamps, contextual metadata (such as tags), and more.
Once this data is gathered within traces, it can be analyzed and visualized. This offers visibility into the microservices architecture, empowering engineers to monitor and troubleshoot performance issues, errors, and latency problems.
Why We Need Distributed Tracing
Distributed tracing delivers several benefits to engineering teams:
- Insights: Tracing provides data-driven, granular insights into the system and into the journeys that requests go through. These insights aid engineers in troubleshooting issues within distributed services, enabling them to develop higher-quality code and expedite deployments confidently.
- Visibility: Engineers gain comprehensive visibility into the system’s architecture and request journeys, allowing them to observe how services interact and manage request flow across services.
- Reduced MTTR (Mean Time to Resolution): Understanding request flows end-to-end helps identify bottlenecks and errors, facilitating faster debugging of existing issues and the prevention of future problems. This simplifies complex development in microservices, enhancing overall quality and speed.
- Cross-Team Collaboration: In a microservices setup, individual services are often the responsibility of different teams. When each team can observe how their requests are processed across other teams’ services, collaboration becomes more efficient in addressing and preventing issues.
When to Use Distributed Tracing
Distributed tracing shines brightest in distributed architectures where visibility into complex service relationships is lacking. Monolithic architectures tend to be more straightforward in this regard, with a plethora of monitoring and testing tools available. Conversely, the connections, dependencies, and correlations in microservices are often less clear.
In microservices, engineers often face uncertainty about the impact of code changes. With services scattered across various environments like virtual machines, containers, and more, pinpointing the root cause of issues or predicting the impact of code deployments becomes challenging.
Consequently, when problems arise, engineers may find themselves investing considerable time and resources in understanding the “what” and “why.”
Other data sources, such as logs and metrics, don’t address these needs adequately. Logs can be too high-level (metrics), too specific (logs), or may not monitor the relevant parts of your system to provide engineers with the answers they seek.
Challenges in Distributed Tracing
While distributed tracing offers numerous advantages, its implementation presents challenges:
1. Instrumentation Overhead
Introducing tracing often involves adding extra code (instrumentation) to capture relevant data. This can increase complexity and potentially introduce performance overhead, necessitating careful management.
2. Distributed Context Propagation
Maintaining context across multiple services in highly dynamic microservices architectures can be challenging. Accurate context propagation is vital for precise tracing.
3. Privacy and Compliance
Tracing data may contain sensitive information. Ensuring compliance with privacy regulations and safeguarding sensitive data while maintaining traceability is a complex task.
Distributed Tracing vs. Logs
Logs are like breadcrumbs left within your application. They offer insights into events occurring within services and can inform engineers about errors and their causes.
However, in a distributed architecture, your code gets distributed, and so do your logs. This is where distributed traces complement logs. While logs provide information about activities within individual services, distributed traces provide insights into inter-service interactions, placing everything in context.
Additionally, distributed traces offer distinct advantages:
- Automation: Unlike logs, which often require manual additions, traces can be generated automatically when using the right tools.
- Observability and Visualization: Traces offer immediate visibility and insights into the system, making it easier for engineers to navigate and understand compared to the sometimes overwhelming volume of logs.
Distributed Tracing and OpenTelemetry
OpenTelemetry is an open-source initiative led by the Cloud Native Computing Foundation (CNCF). It provides a unified framework for the automated collection and generation of traces, logs, and metrics, all under a single specification. With OpenTelemetry, engineers no longer need to manually add traces, making it a valuable addition to complex architectures with diverse data types.
OpenTelemetry captures data from each service it’s installed on, creating spans that are aggregated into traces. Analyzing these traces using external tools provides insights into system performance and service behavior.
Distributed Tracing in BugSnag
If you’re on the lookout for a distributed tracing solution, check out the latest integration between Aspecto and Bugsnag. Aspecto is an OpenTelemetry pioneer that makes it easy to get down to the root cause of errors captured within BugSnag. The integration is designed to make distributed tracing valuable for your team, and it’s an excellent solution for error handling combined with OTel-native tracing. Read our docs to learn more.