Real User Monitoring
Real-time data on real-user experience. Really.
“BugSnag [Real User Monitoring] gives valuable insight into the real-world performance of Concepts, an award-winning app used by millions of creative people worldwide, across the many devices and platforms we support. Ensuring that our app is fluid and responsive is important to our customers and this is a powerful tool to help deliver on that promise.”
David Brittain, CEO, TopHatch
Improve end user experiences by sorting out what matters to your users
Zero-in on slow performance
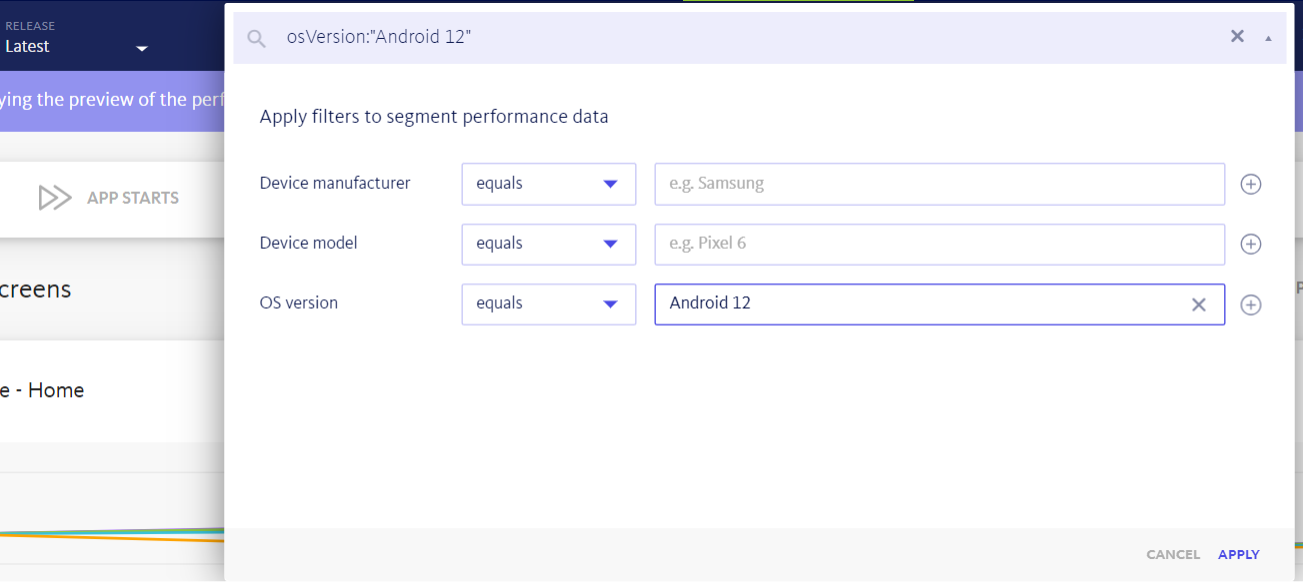
Identify performance outliers with search and segment. Use our search builder to monitor performance in crucial areas of your app and segment your user performance data based on development priorities.
Sort and filter spans by multiple attributes in your table view. Drill down into specific instances in a single click to see the full trace and gain insights into what’s causing slow performance.
Build a segment with the release filter set to latest and os_version:android_12
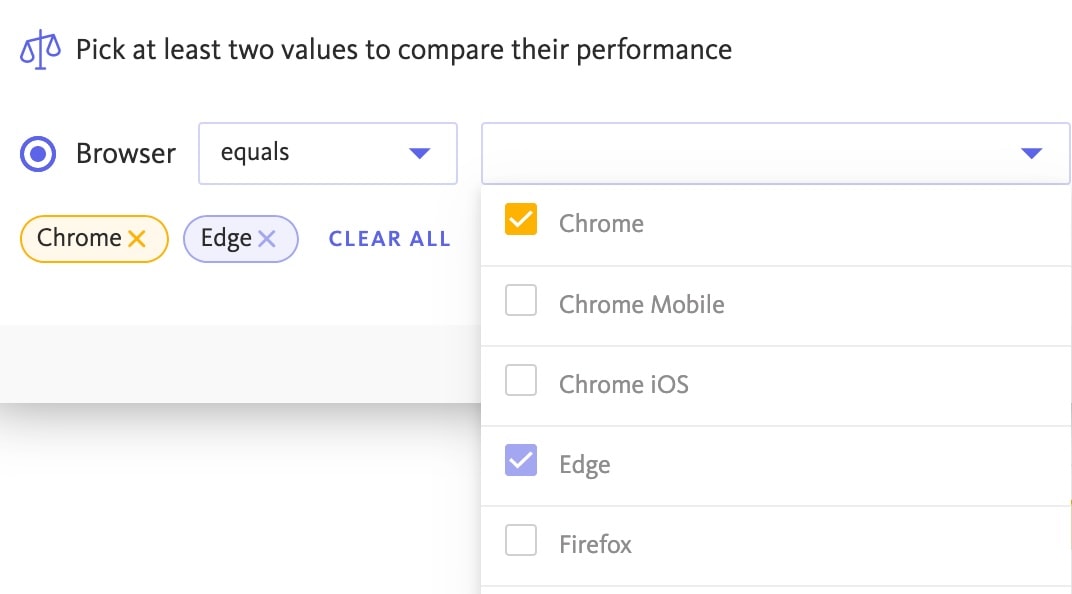
Get deeper insights with performance comparisons
Need to go beyond search and segmentation? Use performance comparisons to highlight the performance of a span across segments. By configuring multiple filtersets, you can access a deeper layer of granularity of your app’s front-end performance.
Whether it’s comparing performance metrics of your last few releases, or comparing performance between browsers, OS versions, or device type, the performance comparison tool allows you to identify key areas of improvement and streamline your workflow.
24/7 Monitoring of your most vital metrics
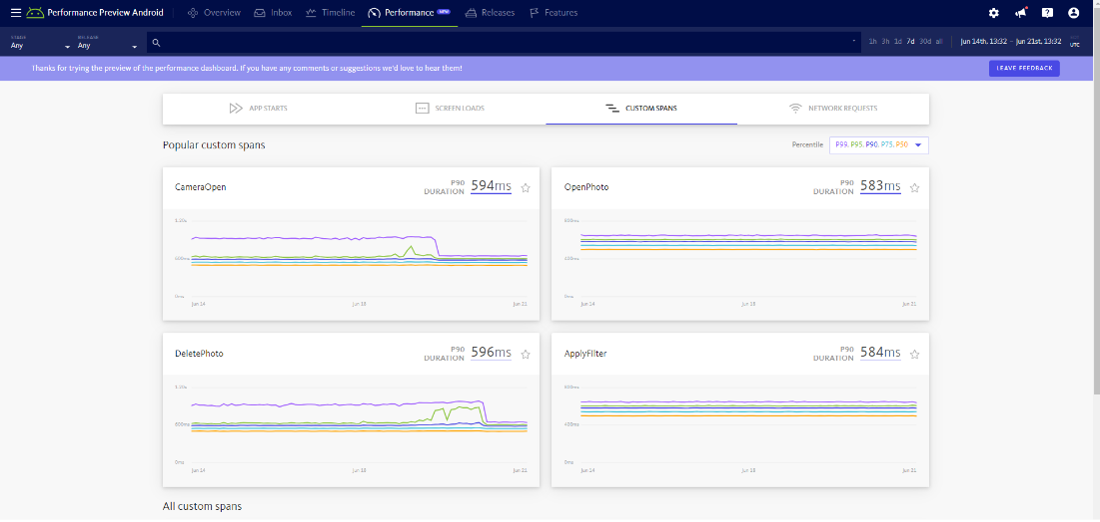
Keep tabs on the most important functions of your app where your users expect high performance. Our performance dashboard has dedicated tabs for operations like app starts, screen and page loads, and network requests. You can proactively identify slow performance before your team is overwhelmed with user complaints.
Monitor any operation in your app by adding custom spans so your whole app is covered. Pinpoint issues and leverage user metadata like OS versions, browser version, and release so you can determine if an issue is widespread or only impacting a segment of your userbase.
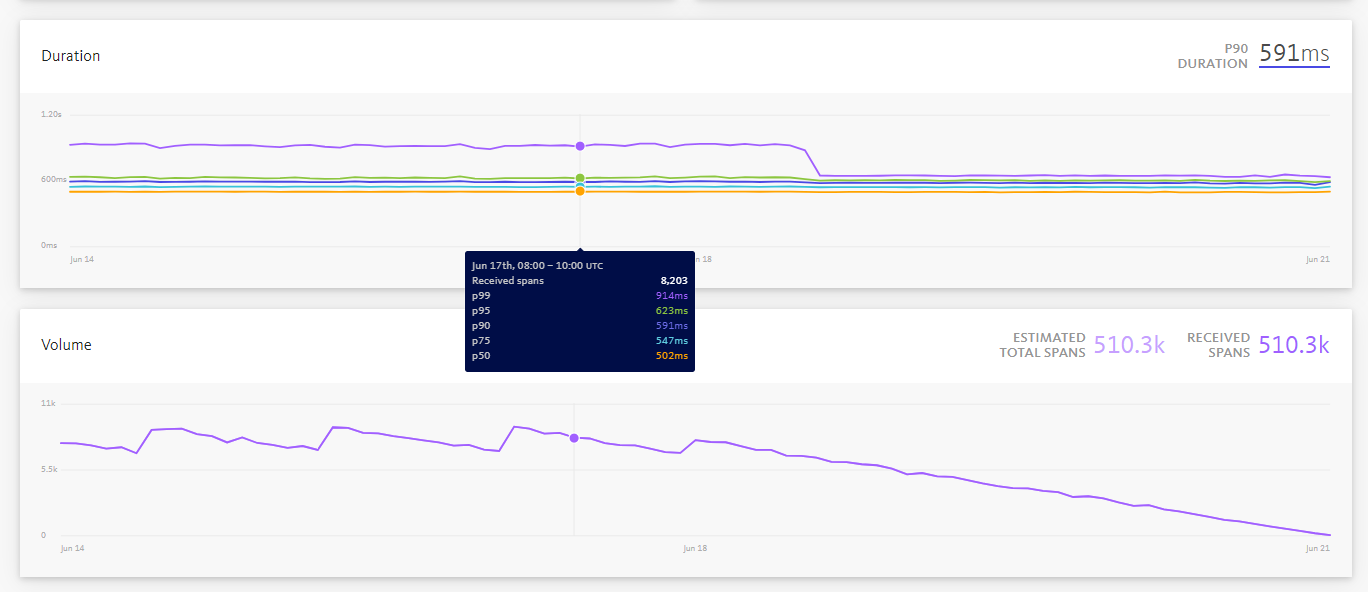
Observe performance trends with timeline views of action duration and volume
Make it easier for you and your team to identify trends and spot performance issues. Examine trends of key client-side performance metrics like web vitals and user action latency over time with our interactive timeline view that features up to 30 days of user performance data.
Click and drag on the timeline to zoom in on metric spikes for more granular analysis and additional context behind an issue.
Built for developers, by developers
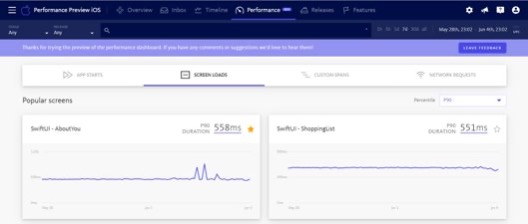
Customize your dashboard by selecting your most popular screens, page loads, and more
Star your most popular app screens, page loads, and network requests to have them at the top of your dashboard. No more digging to get to the issues that matter most to your users or your application.
Add unlimited custom spans to personalize your insights to your section of the codebase. Spot a front-end performance issue and be armed with the right data to address the root cause.
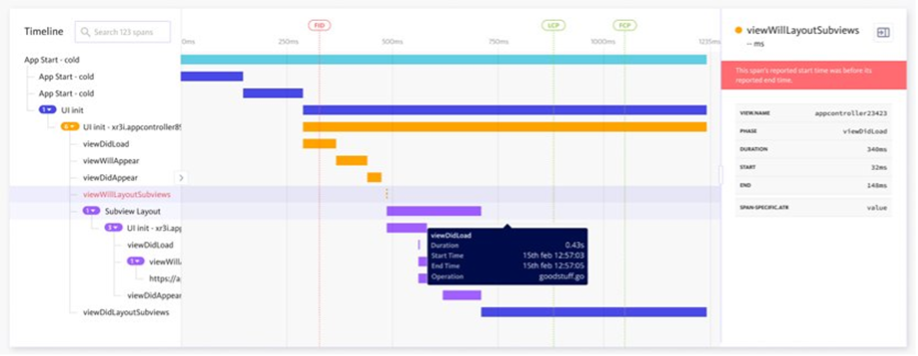
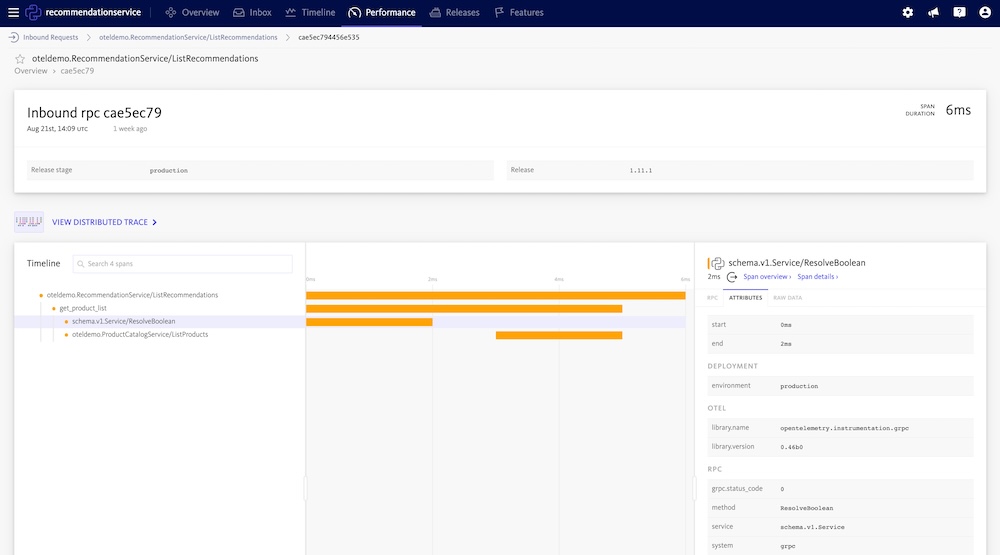
Get context behind specific user actions with waterfall views of performance traces
Don’t just identify areas of slow client-side performance. Collect actionable metadata for additional insights to speed up MTTR. Breakdown performance traces into digestible waterfall views of parent and child spans in a single click.
Establish not just what went wrong, but where, why, and how. Want to get even deeper? Use BugSnag’s distributed tracing solution to dig into root causes and inspect any trace.
Increase insights without increasing costs
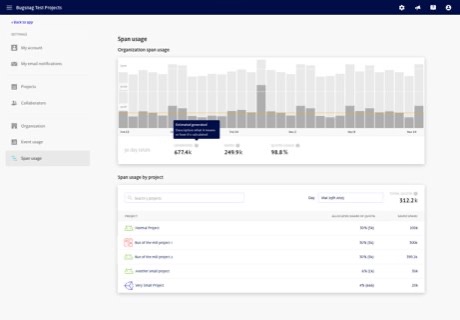
Consistent daily insights into user experience with built-in dynamic sampling
Never lose sight of your users’ digital experiences. Maintain steady levels of insight into vital front-end performance metrics to stay one step ahead of slow app performance.
BugSnag dynamically samples your spans so you automatically meet your daily quota. Our plans are designed to deliver everything you pay for without exceeding your quota due to unpredictable spikes.
OpenTelemetry compatibility and auto-instrumentation to save you time and telemetry data costs
Data is key to delivering a great user experience – with it, how can you tell what’s happening on the front-end of your app? That’s why BugSnag is compatible with OpenTelemetry, which allows you to control your data 100% - no surprise overages, no vendor lock-in.
Saving time and money is always important, and you can do both with BugSnag’s lightweight Performance SDK. Get up and running in minutes and decide how customized you want your data to be. It’s all up to you.