Looking for an alternative to APM tools for error and performance monitoring?

Increase productivity with a tool designed specifically for developers
Do your AppDynamics, Datadog, Dynatrace, or New Relic solutions include the features your developers need? To find out, ask them:
- Do you have a login to any of these tools?
- Do you log in on a daily basis?
- Do you like using large APM tools like AppDynamics or New Relic for prioritizing and fixing bugs?
Because Application Performance Monitoring tools like Datadog and New Relic focus on running apps, they are geared towards Infrastructure, SRE, and DevOps teams who monitor performance and uptime. These APM platforms weren’t designed for building and improving apps, which is what engineers need.
With BugSnag’s full-stack visibility into app health and user experience, developers can easily prioritize and fix errors and performance issues with speed and agility. Ensure a high-quality customer experience during every interaction.
Bugsnag
Application Performance Monitoring
Purpose
Audience & Ownership
- Building and improving apps
- Running apps
What it does
How it works
- Infrastructure, SRE & DevOps
- Engineering, Product, QA, Support, Client Observability
Application Focus
- Identify errors
KPIs
- Identify and prioritize errors
- Identify and prioritize performance issues
- Deliver actionable insights
- Data output based on aggregates
Motivation
Economic Impact
- Web app is business critical
- Rudimentary mobile support
- Full context behind every single crash and performance issue
- Mobile app is business critical
- Full stack: mobile, web, server-side
- Load and response times
- Uptime and availability
- MTTR
- Stability score
- Performance metrics
- Developer productivity
- App store ratings
- CSAT
- Customer experience
- Customer retention
- App store ratings
- Brand reputation
- Keeping the lights on
- Correlation between code and infrastructure
- Maximizing revenue
- Reducing costs
Get real-time data on real-user experience. Really.
- Identify and prioritize performance issues that are impacting your app so you can improve end user experiences.
- Get 24/7 monitoring of your most vital metrics, including app starts, screen loads, and network requests. Create custom spans to monitor key areas of your application.
- Increase insights without increasing costs using built-in dynamic sampling. Control your telemetry data and only pay for the insights you need.
- Make data-driven decisions with confidence to improve your users’ experience, resulting in stronger customer loyalty and recurring revenue.
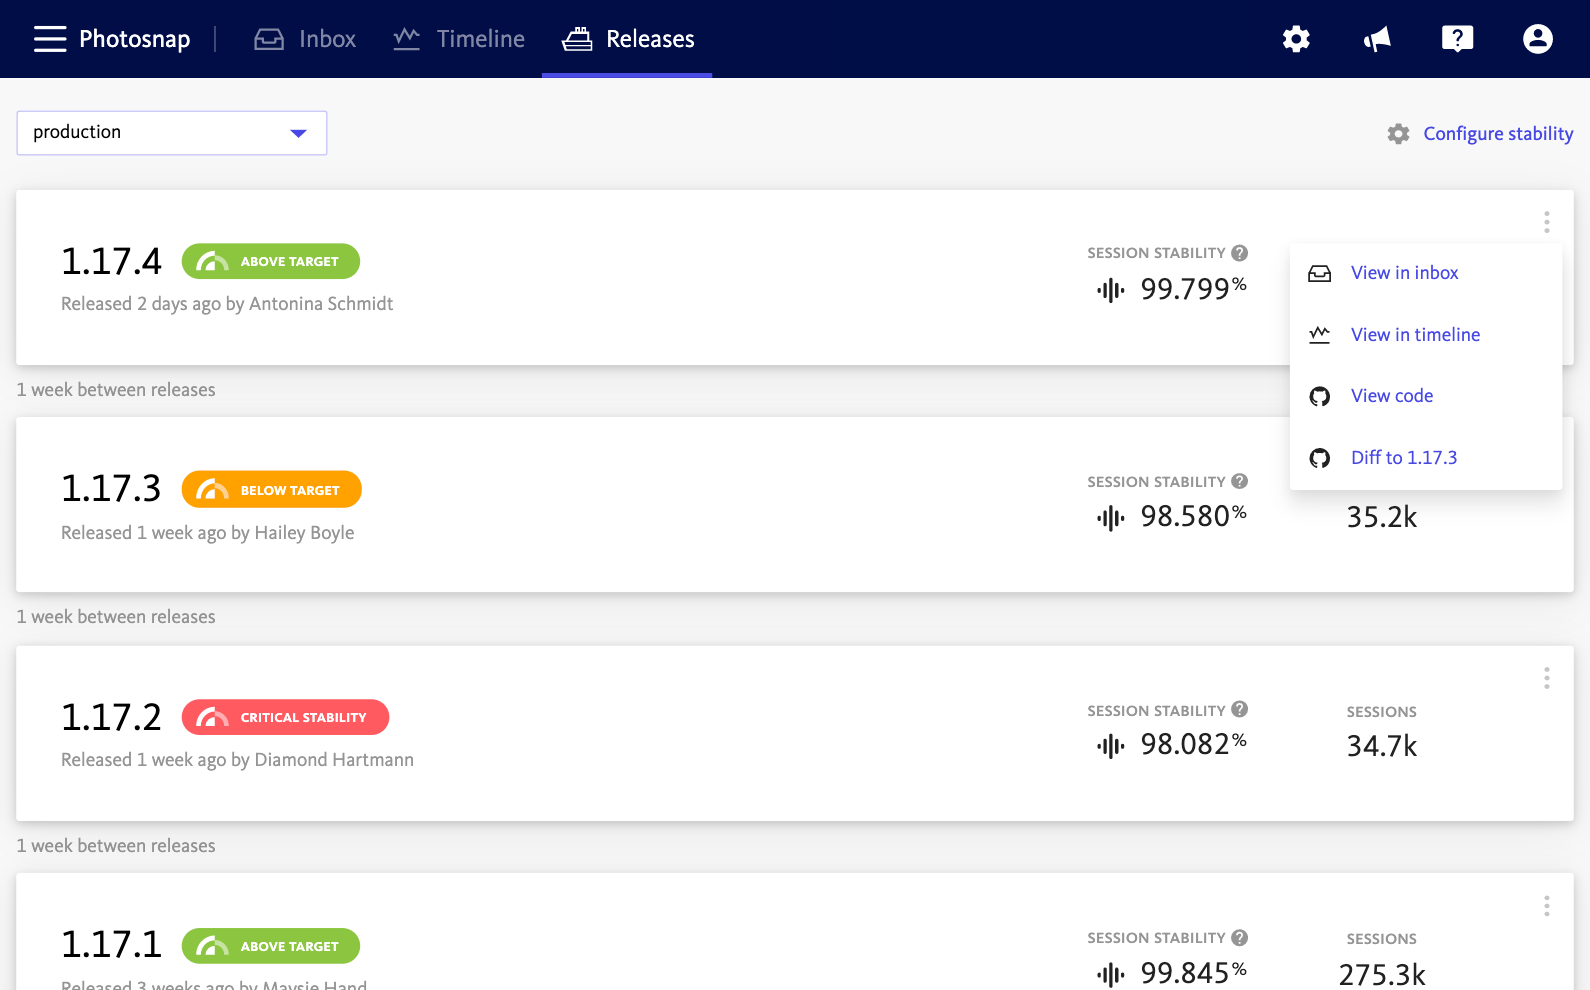
Monitor and track application stability in real-time
- Measure application stability for every release and receive actionable insights that
determine when it’s the right time to build new features or fix bugs
- Facilitate cross-team decisions by using stability scores to monitor application health
against SLAs and SLOs and by setting critical stability and target stability goals
- Pinpoint which errors have the greatest impact on application stability and key customers to
determine prioritization
- Use the release health dashboard to ensure high-quality releases and features, promote builds, roll back unstable code, and make errors actionable
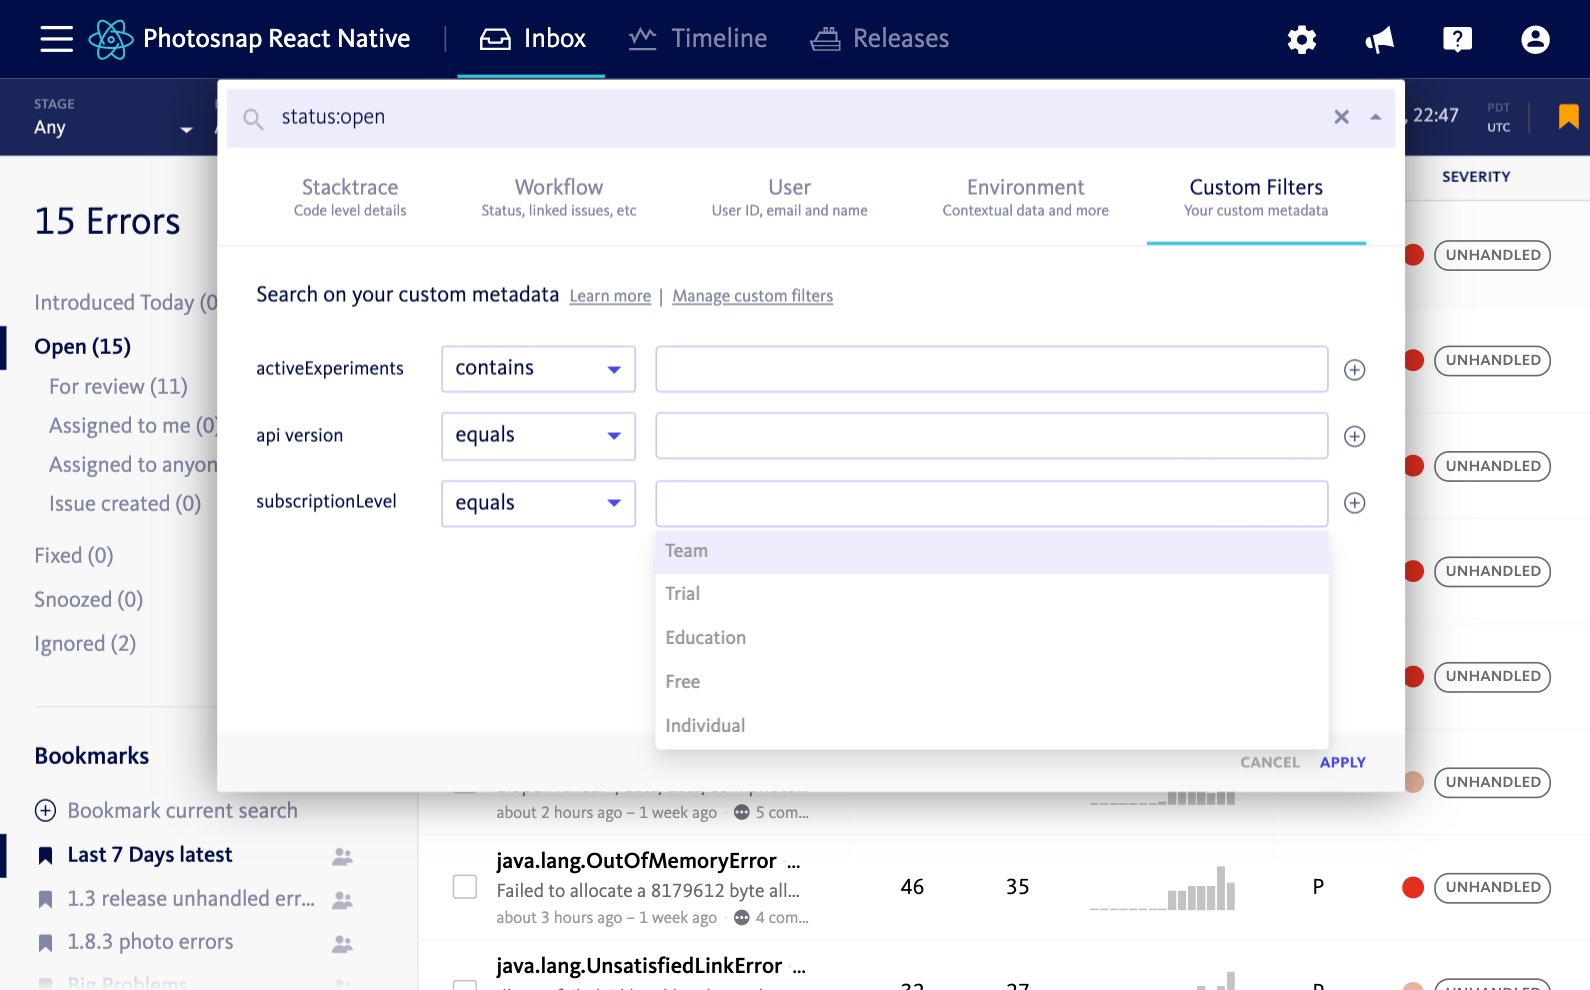
Discover the right bugs to fix with complete control over segmentation
- Provide developers with the source and full context of every error and crash.
- Decide how to best address errors and keep key customers happy when you filter by spend,
SLA, or subscription tier to boost app stability.
- Use the search bar to segregate events by device, application, thread, experiments,
stacktrace, and custom attributes.


Connect BugSnag to your current tools with ease
Engineering teams rely on a variety of solutions in order to work within and across teams,
including tools for issue tracking, data forwarding, and chat. BugSnag recognizes the importance
of fitting into this ecosystem and integrates with more than 40 tools, including Slack, Jira,
DataDog, GitHub, and Splunk.