
Compare Performance Metrics Across Key Data Segments
If your team is forced to do more with less, you’ll need to prioritize your work effectively. You don’t just need data, you need actionable intelligence that directs focus where it matters most: understanding the performance profile of a new release, or identifying the factors causing specific performance bottlenecks, from sluggish browser versions to operating systems.
But metrics can be useless in isolation without the proper context. Luckily, BugSnag now allows you to go beyond search and segmentation to get deeper insights with Performance Comparisons. Whether you compare performance between device types, browsers, or releases, all the data you need will be easily available.
Core functions of Performance Comparison
Performance Comparison allows developers to create multiple segments of performance data and see the results simultaneously. You will be able to compare metrics over two or more filtersets instead of looking at one metric in isolation.
Once you’ve navigated to your performance tab, start your comparison by clicking on the scale icon next to the filter bar. From here, you can add a maximum of three filtersets to compare your data.
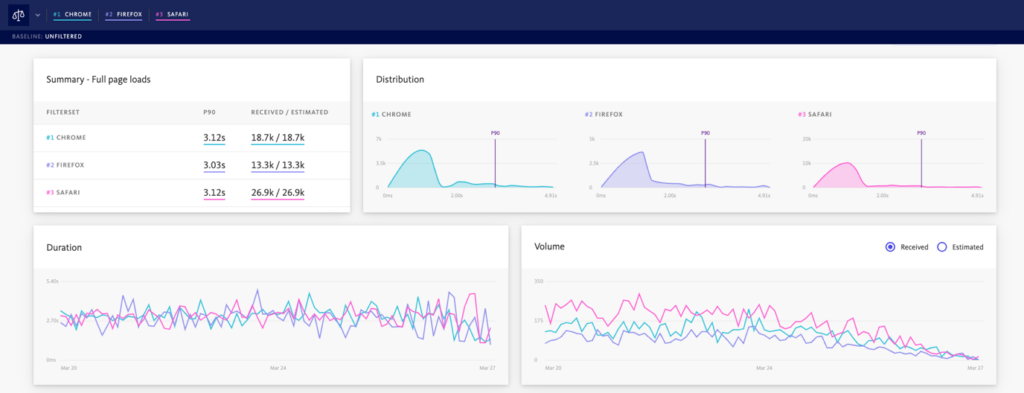
In the example above, the user is looking at full page loads for their web application. Then, they created a filterset for three different web browsers: Chrome, Firefox, and Safari.
Depending on what type of project you’re working on, you can compare the following data:
- Overall performance metrics of releases
- Web: compare performance between browsers and browser versions
- Mobile: compare performance between OS versions
- Mobile: compare performance between device manufacturers and device models
As you navigate to other areas of your app’s performance (such as app start times, network requests, and custom spans), the filtersets you have created will persist, so you can easily see the same comparisons across different performance metrics.
Check out our Performance Comparisons docs to learn more.
Why is performance monitoring important?
Performance monitoring is critical for modern businesses offering SaaS or consumer applications. Here are some benefits of implementing a performance solution for your team:
Quickly Surface Issues: performance monitoring enables organizations to quickly identify performance issues impacting production users – even if they don’t report them. That way, you don’t need to rely on support tickets to be aware of poor end-user experiences.
Monitoring Key Operations: with performance monitoring, engineering teams can monitor start times, screen loads, network requests, and any other operation chosen to instrument.
Detailed Actionable Data: span details are captured and displayed intuitively to show engineers exactly where time was spent in an operation, helping them get to the heart of the problem as soon as possible.
Targeted Segmentation: filter user performance aggregates and graphs to see the characteristics of relevant attributes including device type, OS version, and app release, allowing fine-grained insight into the performance of different cohorts.
Conclusion
Understanding your data with the proper context and comparisons is critical for modern organizations that need to deliver high-performing applications.
With performance monitoring from BugSnag, you’ll experience developer-first observability so you can quickly identify and prioritize performance issues impacting your application. Take control of your user experience!
Try BugSnag free for 14 days, no credit card required. Check out a demo to learn more.