Application Stability Management

Improve the stability of your application
Know when to take action
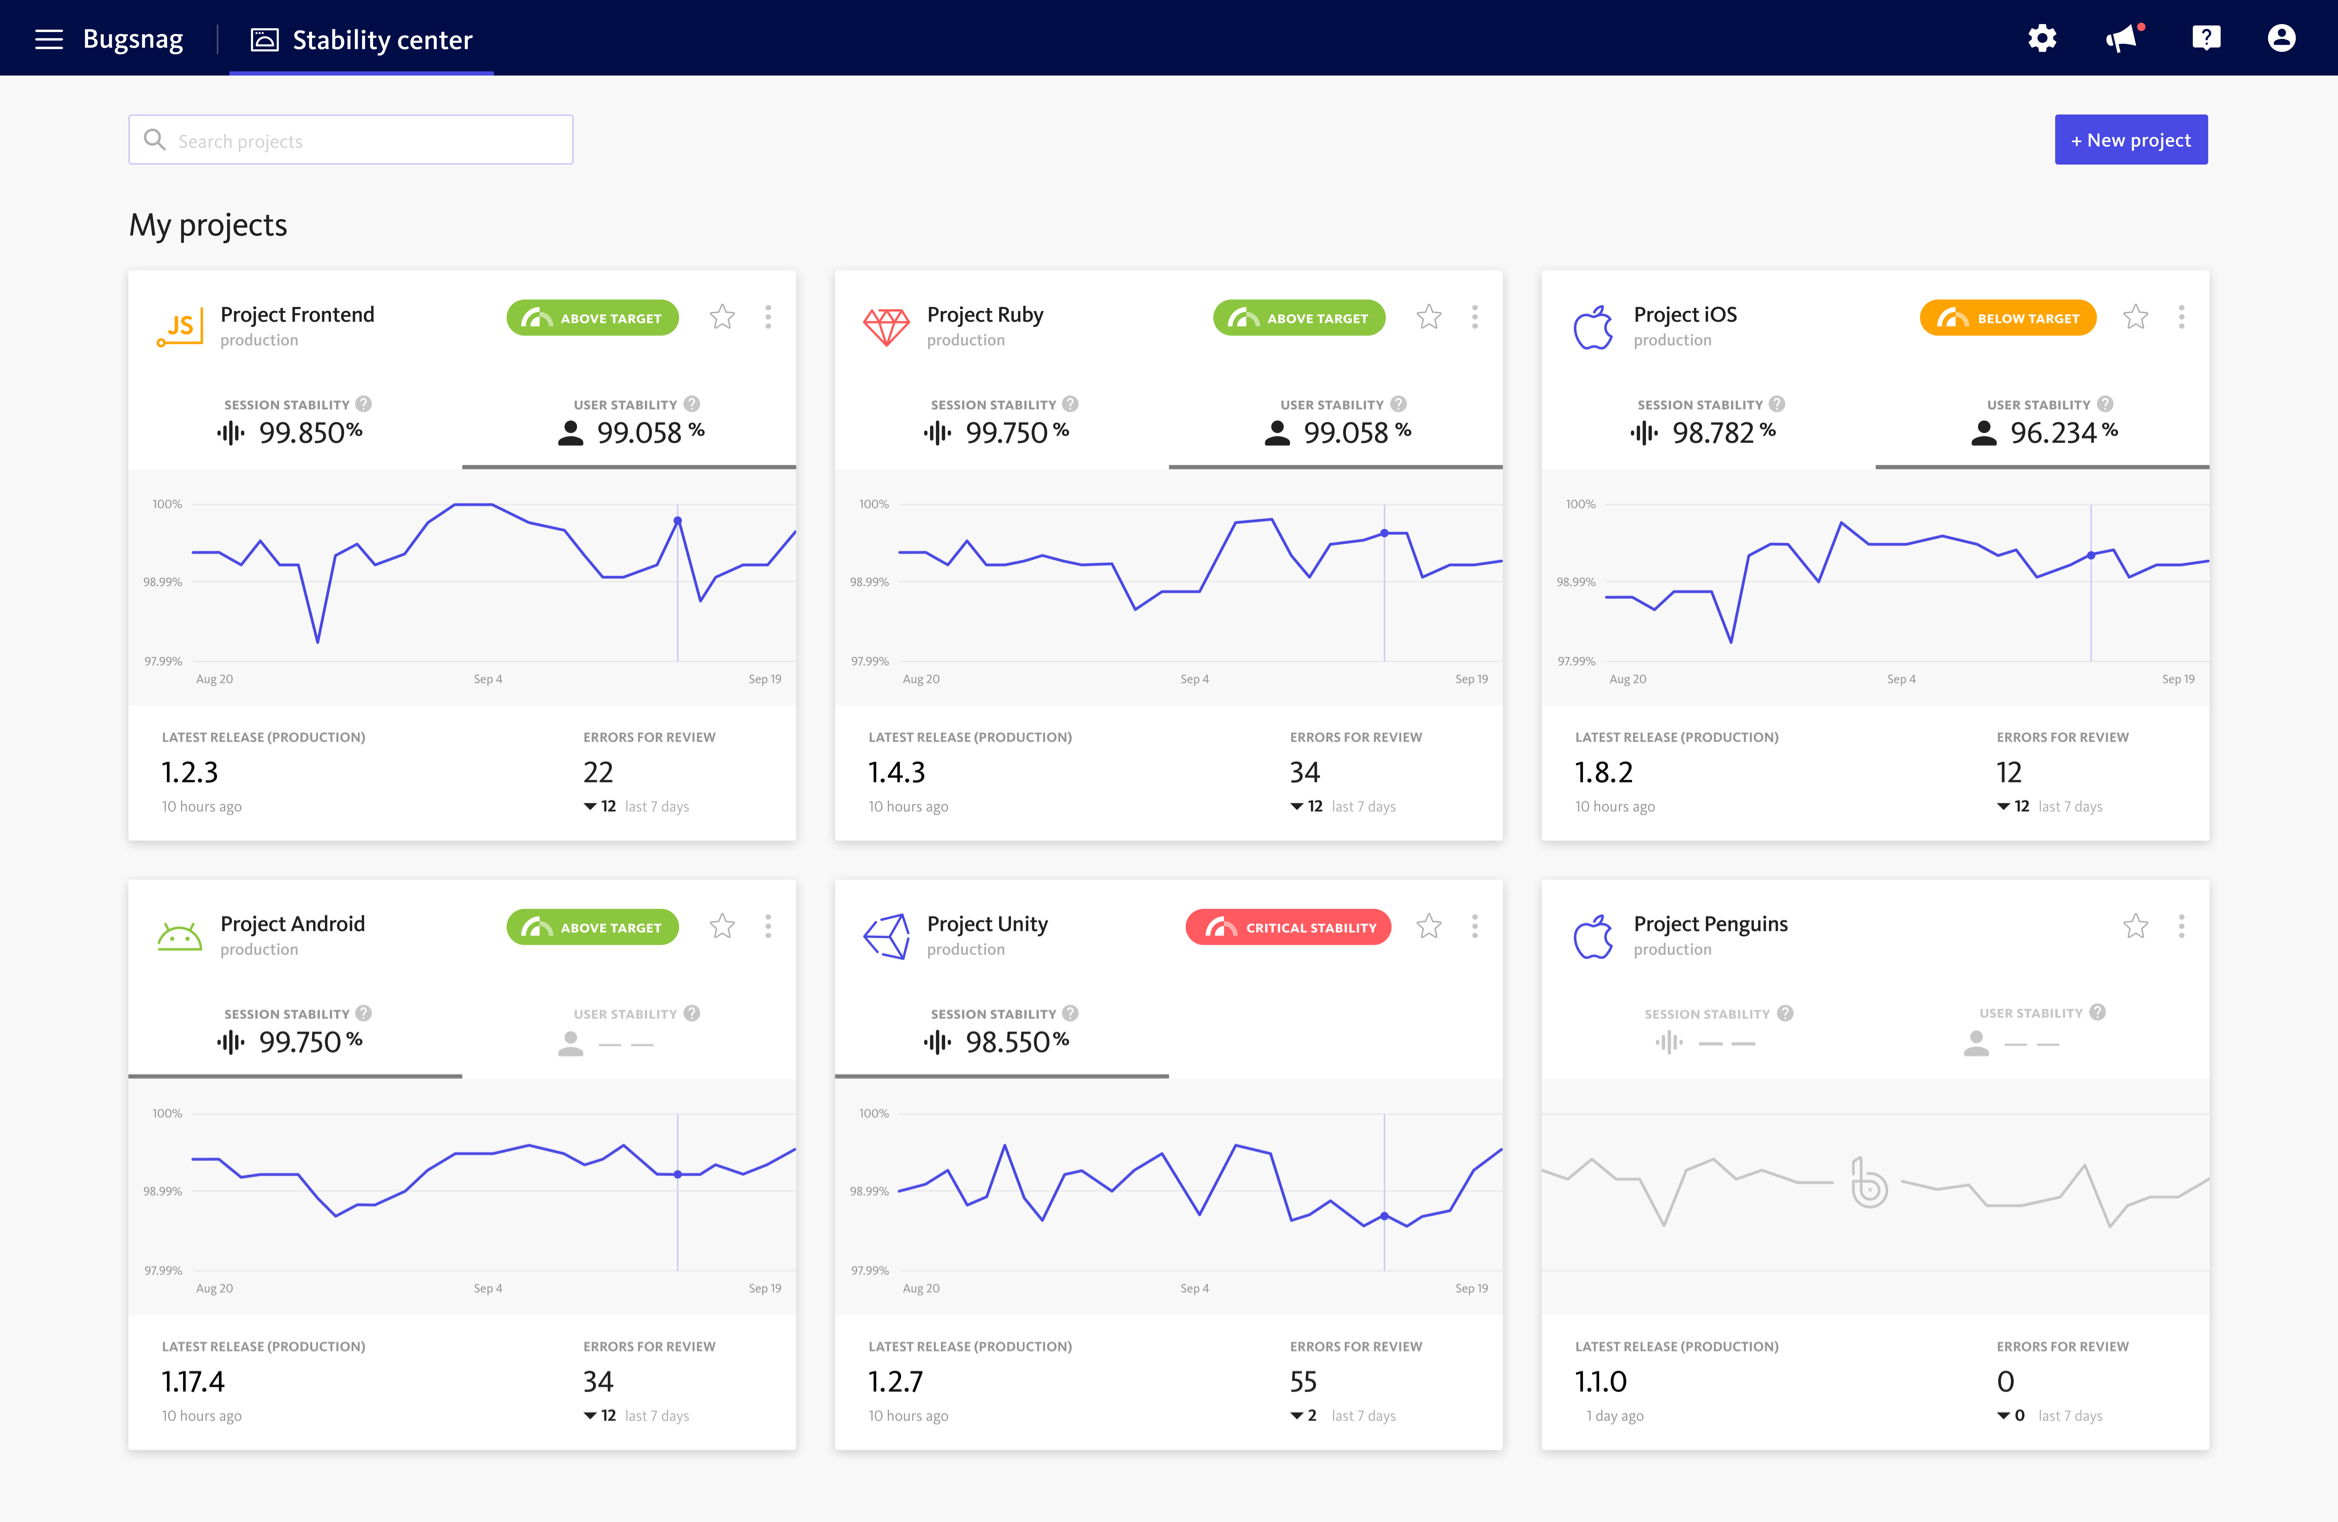
Gain insights into the stability of all applications in the Stability Center
Set stability targets and understand how your team’s progressing towards achieving them in the Stability Center. Graphs provide trends in user and session stability over time so you can understand how application health and user experience is changing.
Use insights to make data-driven decisions about which applications need to be prioritized for bug fixing. You can also monitor how effective the team’s debugging activities are in improving application stability and customer experience.
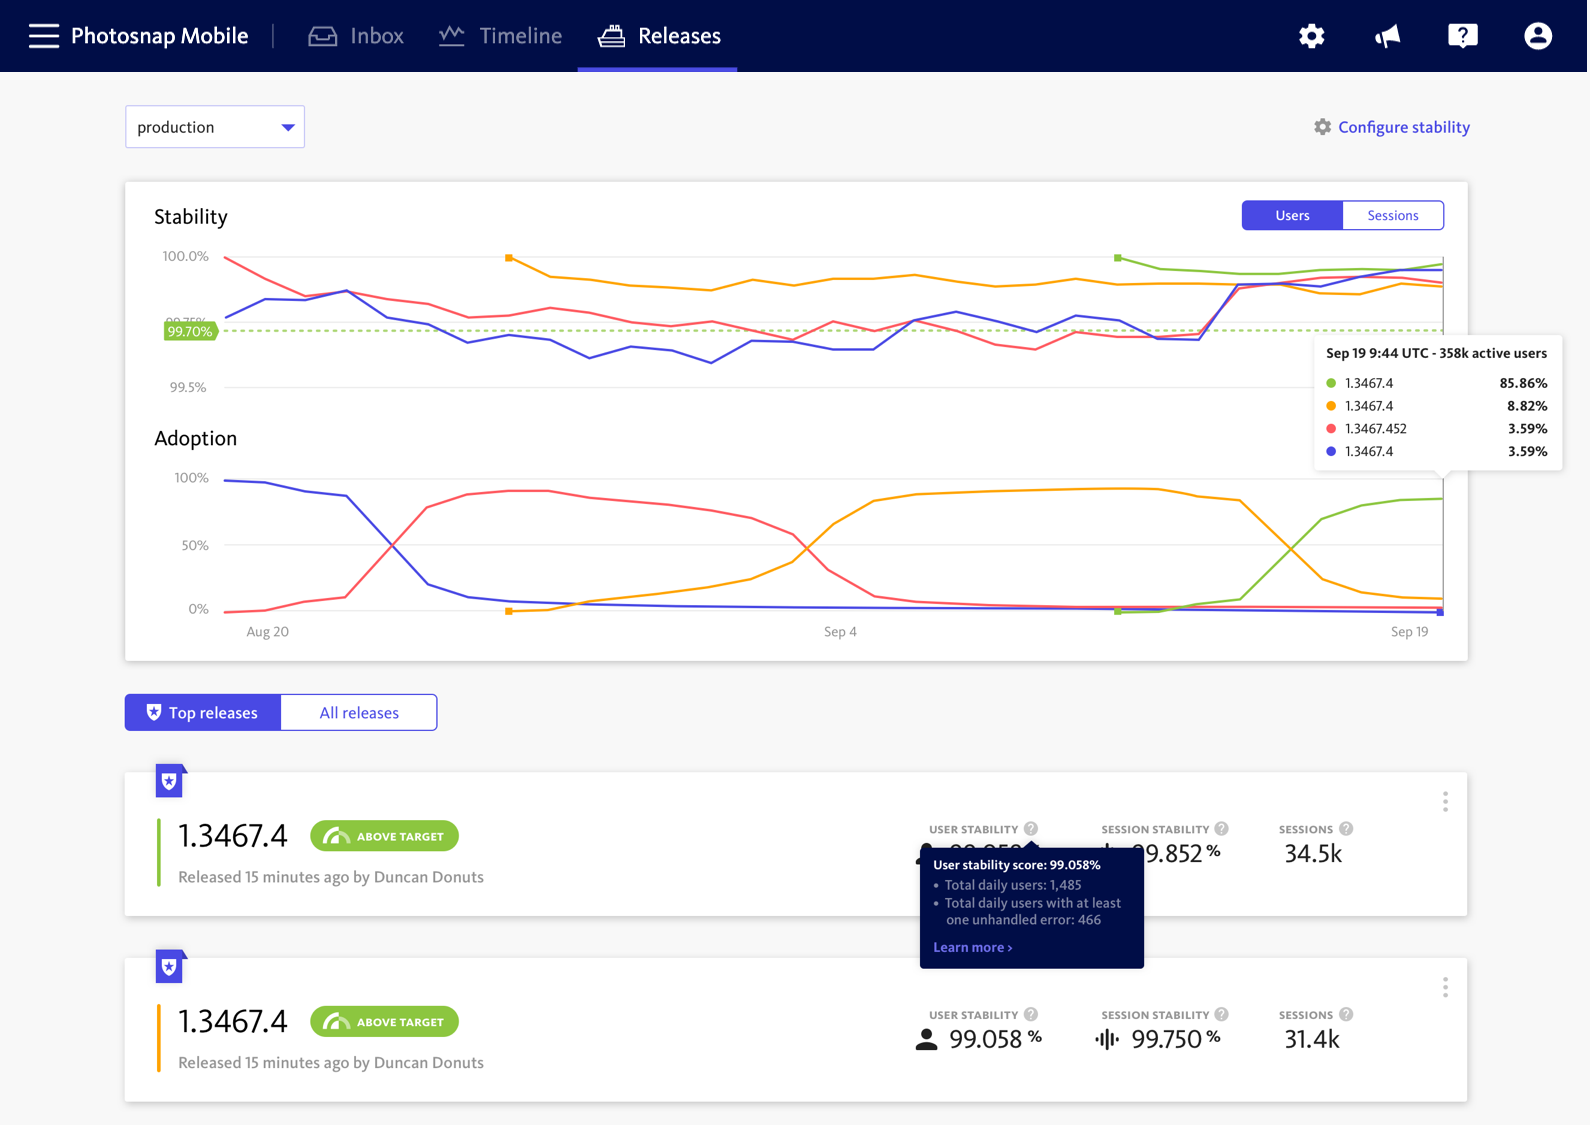
Balance bugs and new features with stability scores
Use the user or session stability scores to help you decide if you need to spend time debugging or if you can move on to developing new features.
Session stability is a measure of the proportion of app sessions that are crash free while user stability is a measure of the proportion of your application’s daily active users who do not experience a crash.
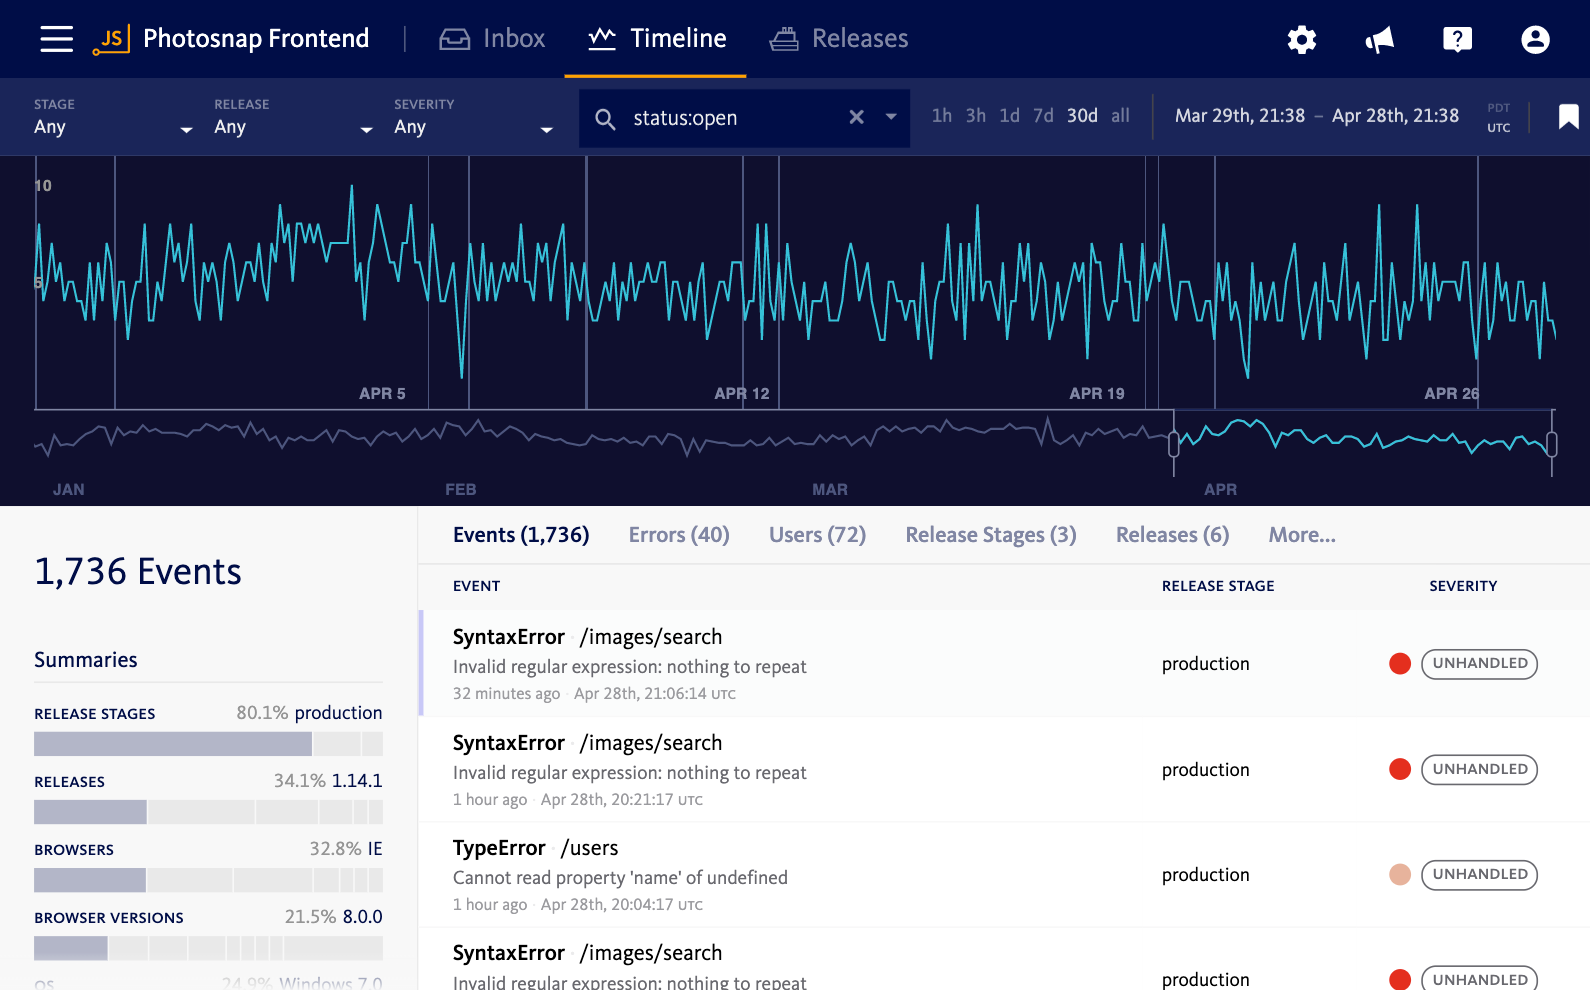
Real-time observability
Investigate stability issues on the timeline to understand error trends, pinpoint error spikes, investigate specific incidents, or determine if a release introduces new bugs.
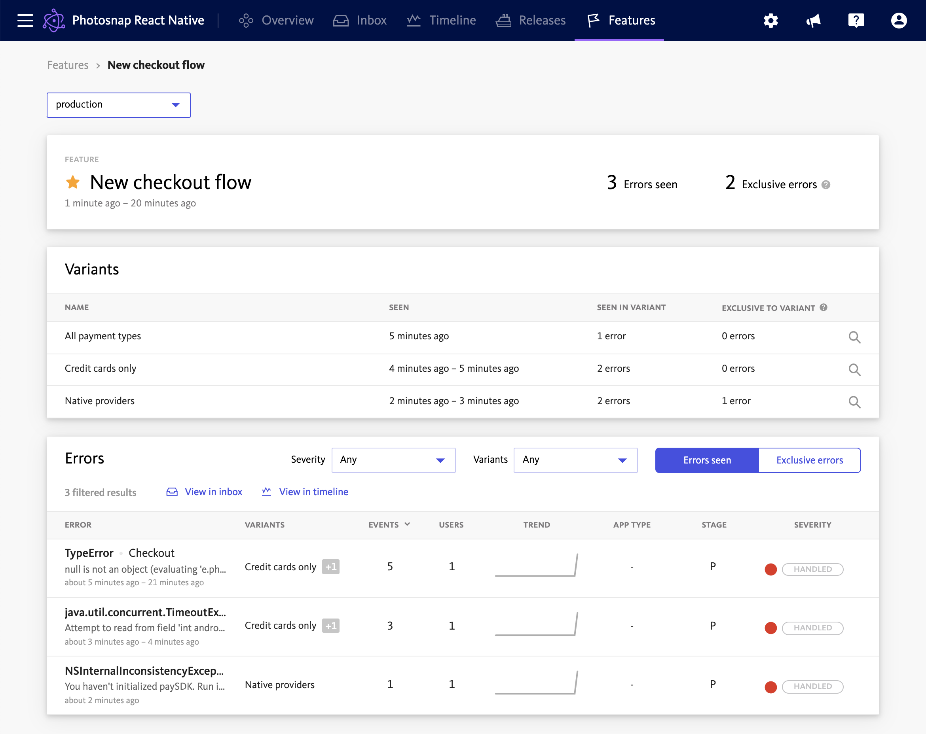
Proactively monitor new features and experiments and make confident, data-driven decisions with the Features Dashboard
Gain real-time error visibility into feature flags and experiments so your team can quickly determine if unusual error activity in the application is related to a new feature or experiment.
Speed the pace of delivery while minimizing risks. Monitor feature rollouts and their impact on user experience with powerful data to drive decisions about releasing to more users or rolling back and addressing issues before re-releasing.
Not all errors need fixing
Quickly assess the impact of each error
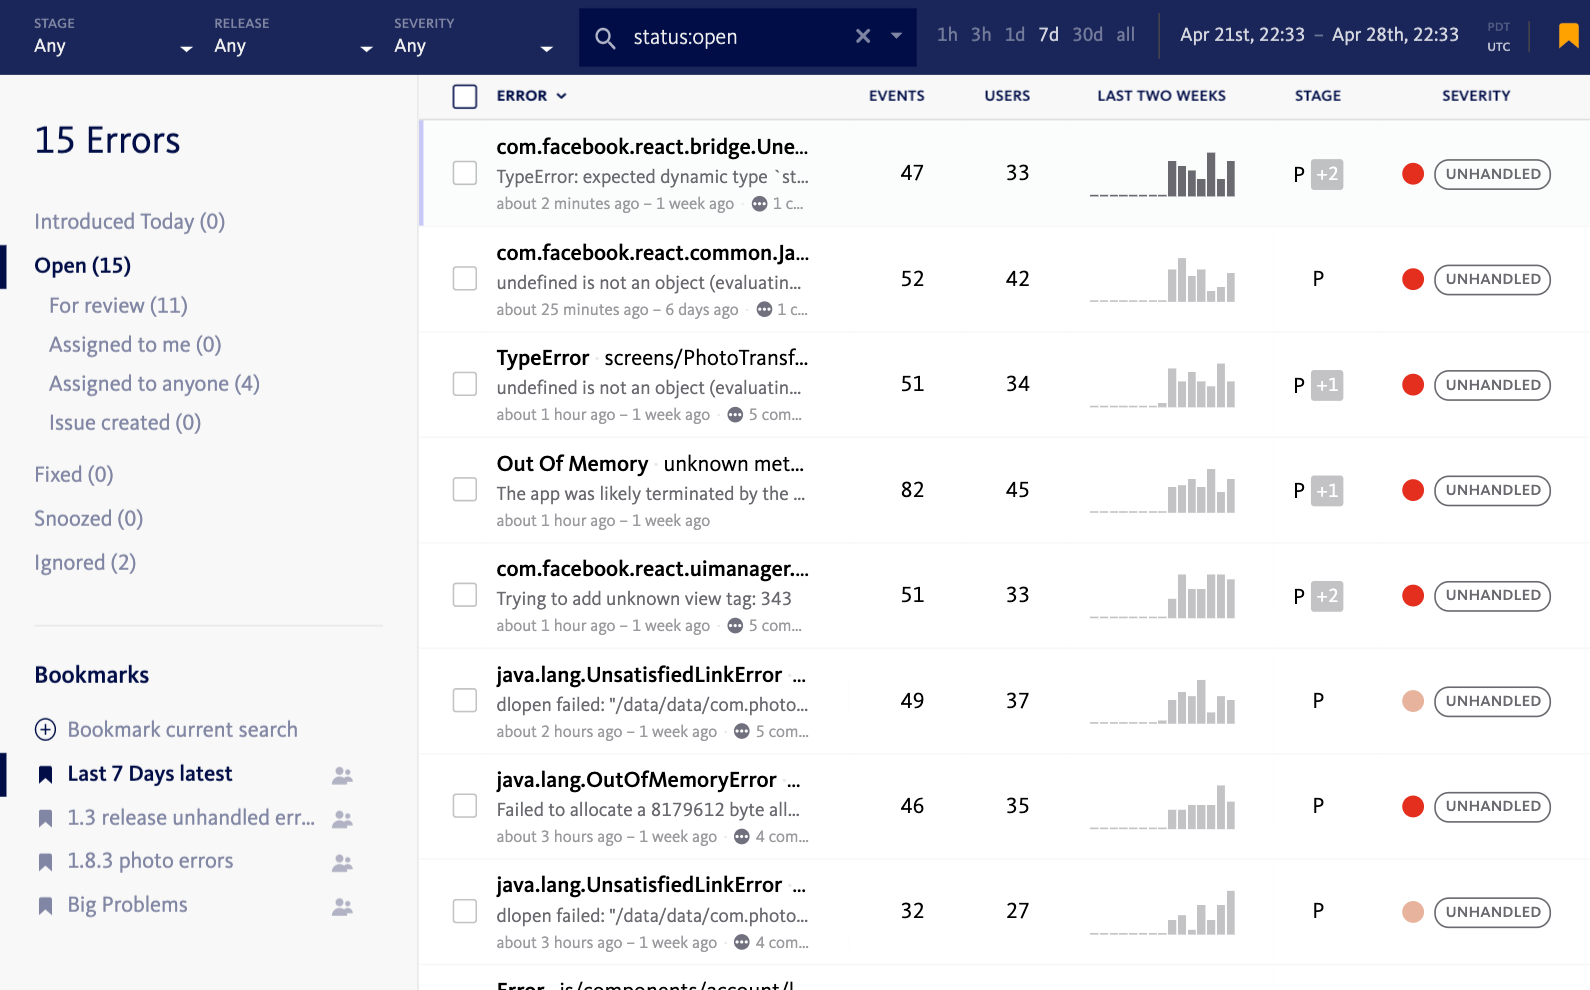
Get the data you need to decide if an error should be fixed or ignored. Sort errors by the number of occurrences or the number of users impacted to stay focused on errors with the most significant impact on application stability.
Workflow states (open, fixed, snoozed) and Jira integration help you collaborate as you make progress on bug fixes.
A personalized view of your app’s errors
Use the search builder to filter errors on multiple attributes and save the search filters with bookmarks. Use bookmarks to keep track of error segments that matter to you, like errors impacting VIP customers, originating from your codebase, occuring in A/B tests or impacting critical app functions.
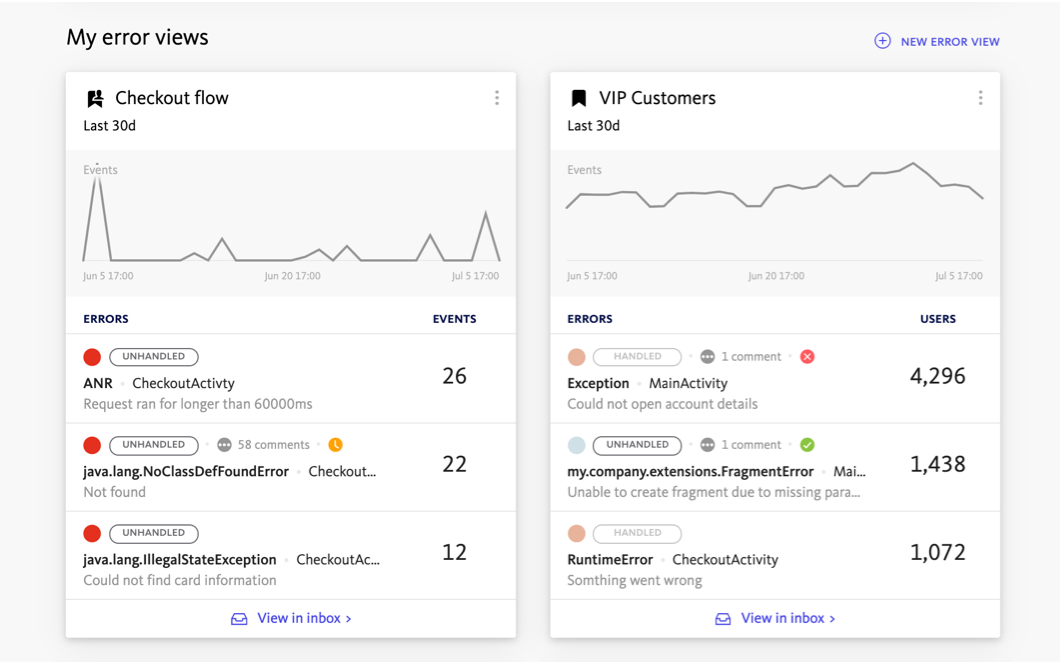
Use bookmarks to create a custom error view in the Project Overview Dashboard and keep an eye on how errors are impacting segments that are important to you so you can prioritize and fix them.
Alerting and Workflow Engine delivers relevant and actionable error alerts
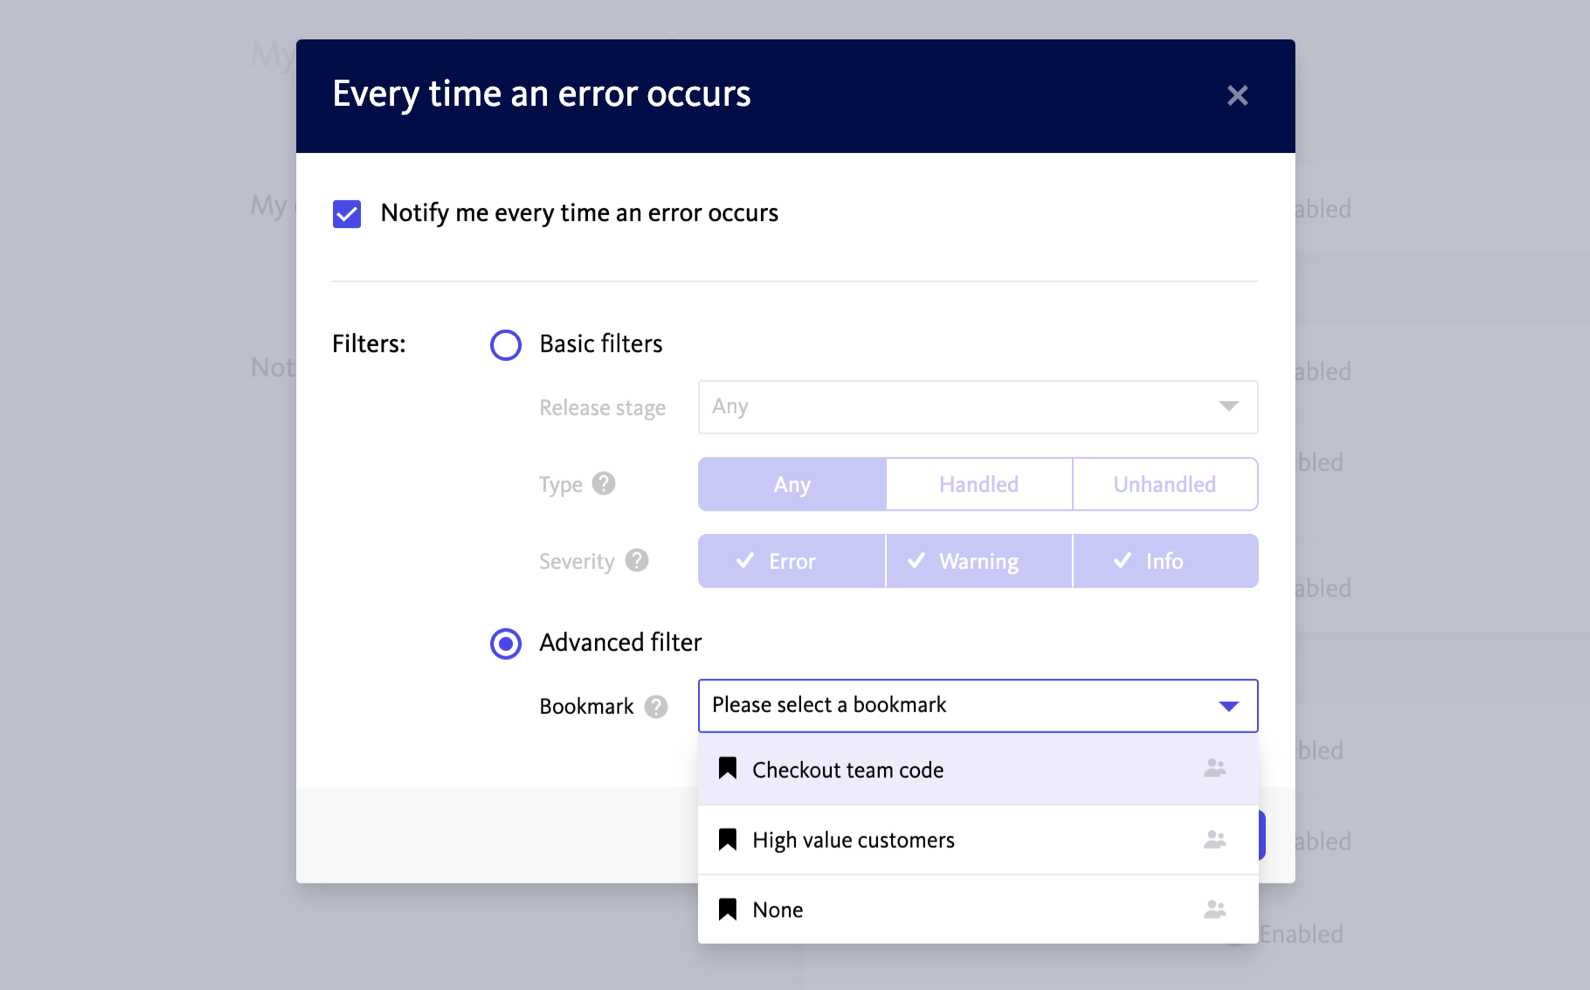
Customize error alerts to be notified of the errors that matter to you, such as those occurring in your codebase, in critical parts of the application, or affecting key customer groups.
Use alerts to drive decisions about error prioritization and resolution, align the team around the bugs that matter, and resolve high impact errors quickly. Additionally, you can streamline debugging workflows with team chat, issue tracker, and incident management integrations.
Swift and straightforward debugging
See the exact line of code that crashed
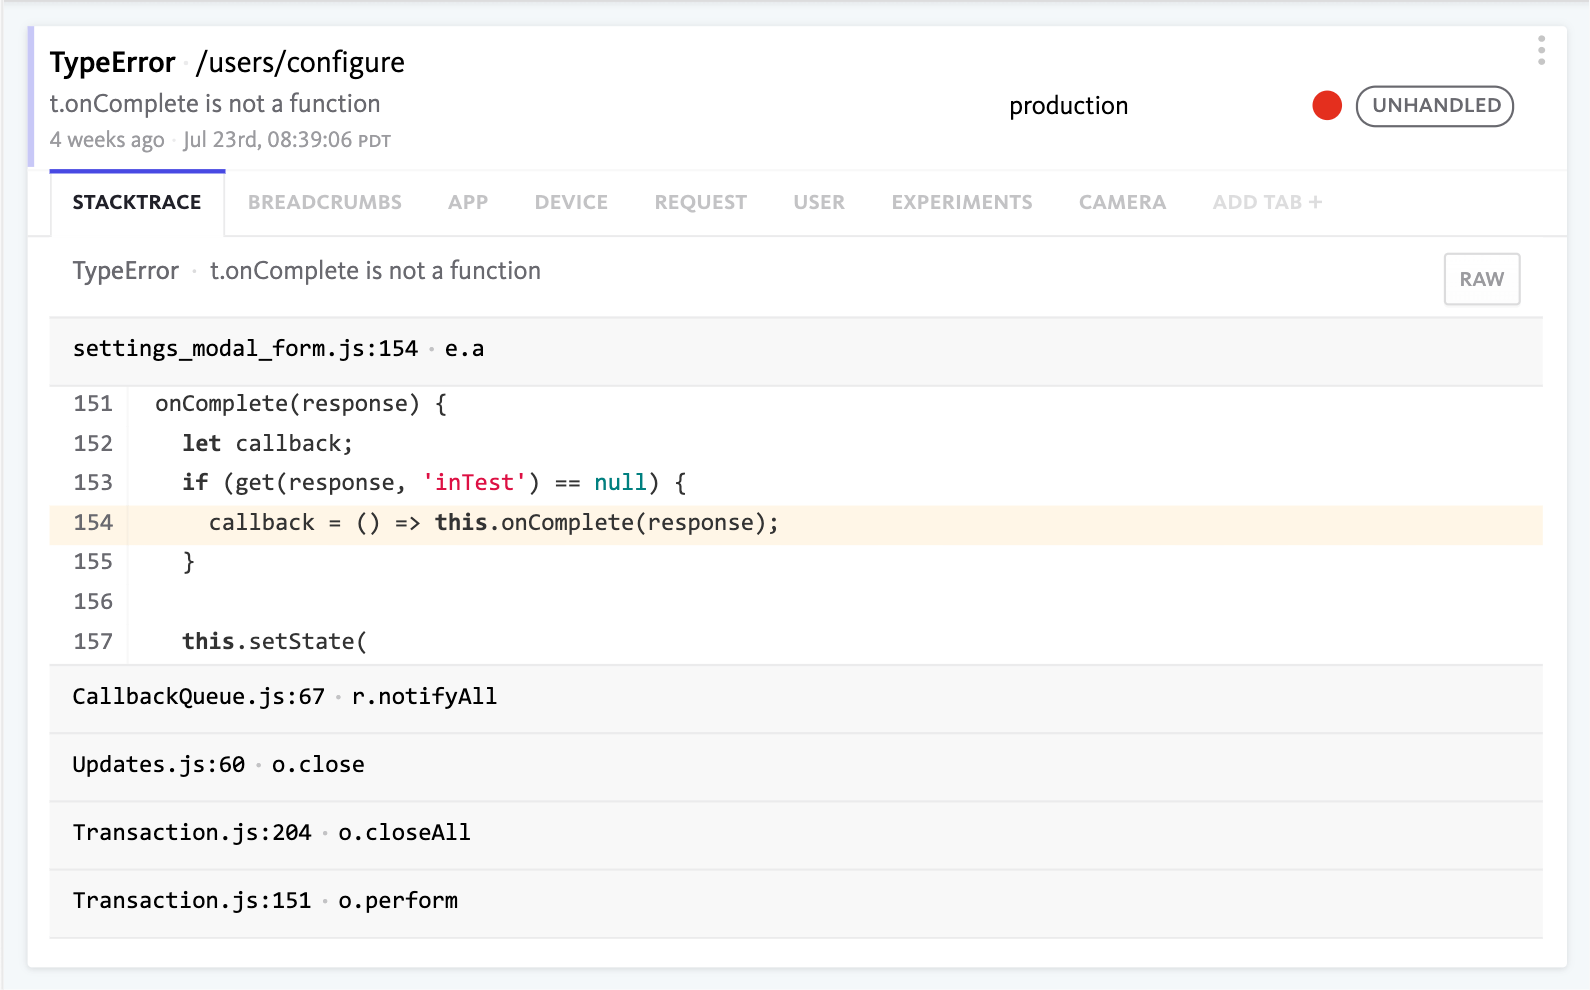
A stacktrace is automatically captured for every error so you can see where it originates in your code. Integrations with source control allow you to access that repo in a single click.
For JavaScript and mobile platforms, we support source maps, dSYMs, and ProGuard, allowing us to show a readable stacktrace from minified or obfuscated source code.
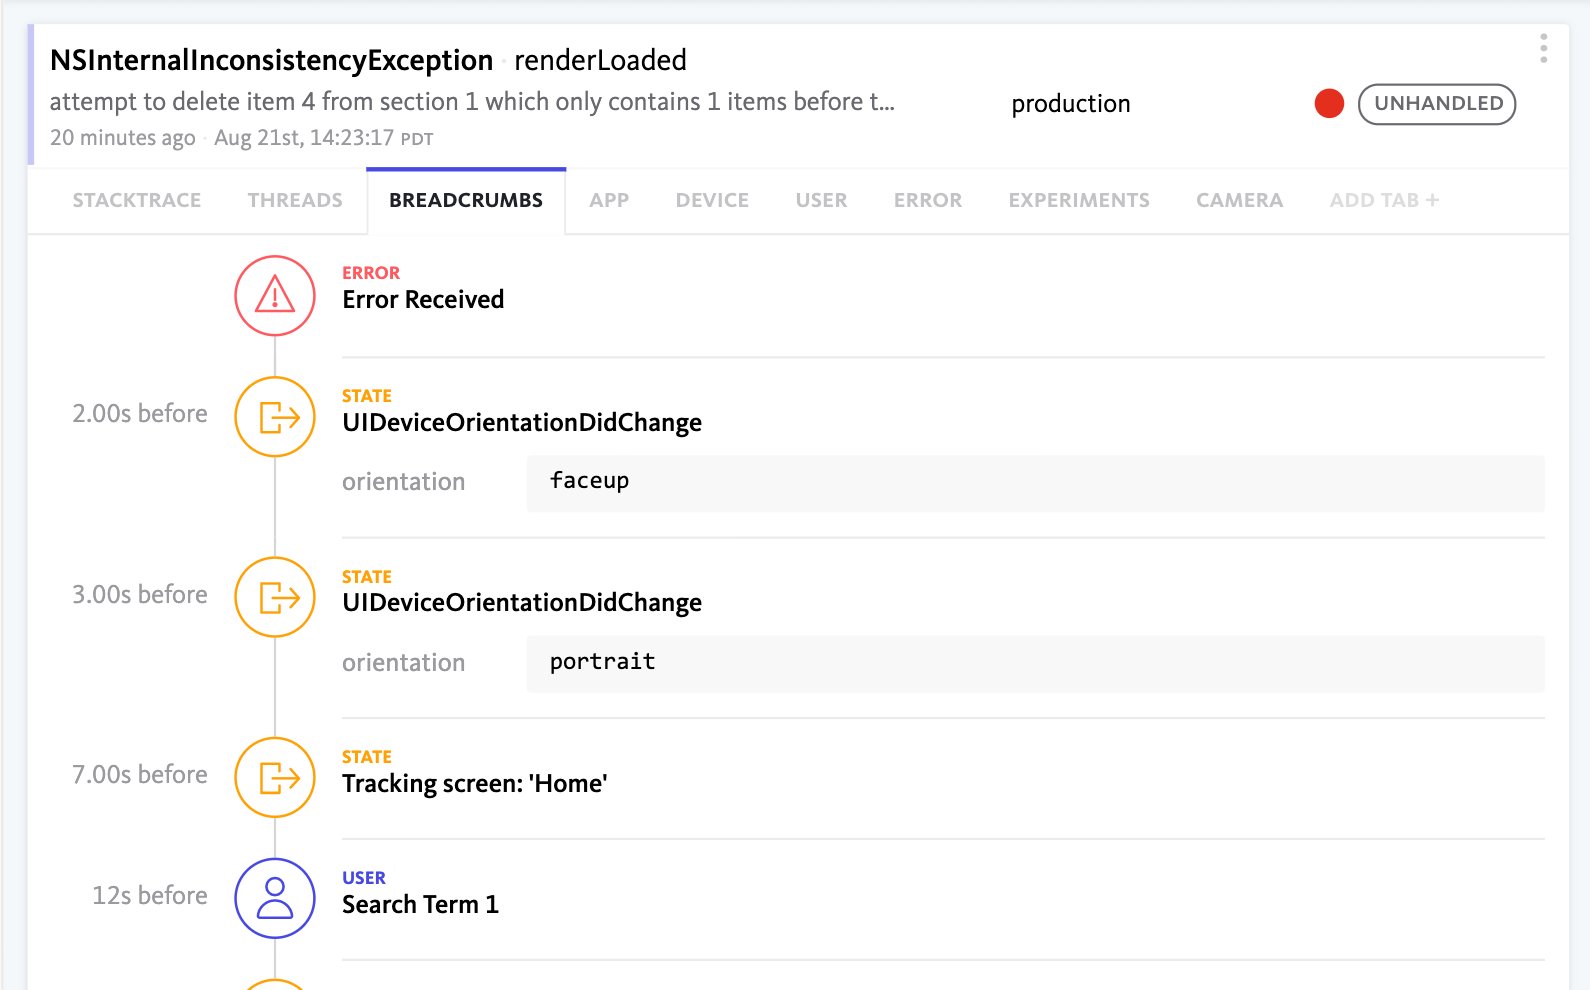
Retrace user actions leading to an error
Automatic breadcrumbs make going back and forth with customers in support obsolete. BugSnag automatically captures a timeline of actions and events, like button presses and database queries, leading up to the error to give you a clear path to reproduce the bug.
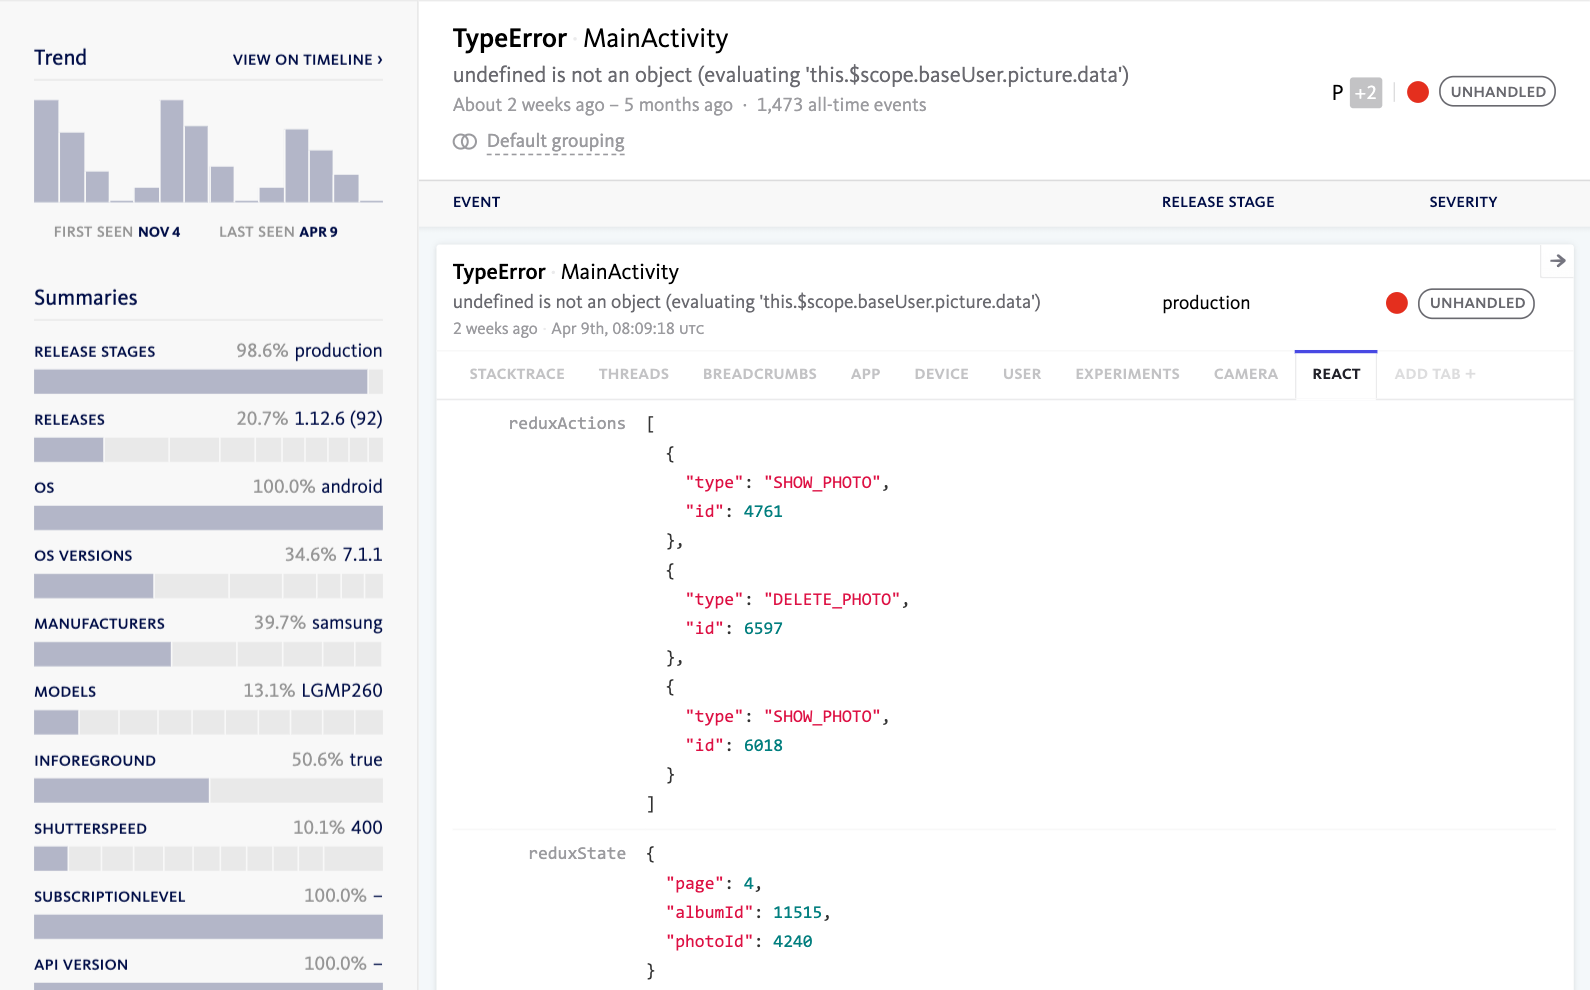
Access the diagnostic data you need
No matter what type of app you are building — mobile, browser, backend — BugSnag automatically captures the error context specific for your application.