
Gain executive insights in the new Stability Center
We’re excited to introduce the Stability Center, a brand new view that summarizes key information about each of your projects.
Last year, we introduced the stability score as a way to measure the stability of releases in Bugsnag—the percentage of user sessions in a release that were crash-free. The Stability Center expands the concept of the stability score beyond releases to provide an application stability score, coupled with insights into how application stability has changed over time.
We believe the most exciting part of the new Stability Center is that you can see the stability of all your applications in one central location. This is especially useful for engineering organizations that use Bugsnag to manage the stability of multiple applications, such as their iOS, Android, and JavaScript applications.
Let’s dive into how the new Stability Center provides executive insights at a glance about application stability, which allows you to make data-driven decisions about which applications need to be prioritized for bug fixing.
Executive insights into application stability
The Stability Center provides a holistic view into the stability of multiple applications and can be used to monitor the full stack, including client and server side applications. Perhaps you’re an engineering leader who is managing teams working on several different applications or you’re a software engineer contributing to multiple applications, you can now see a high level stability snapshot of all these applications on one page. Seeing the stability of each application may also be important in microservices environments, where multiple applications are coupled together.
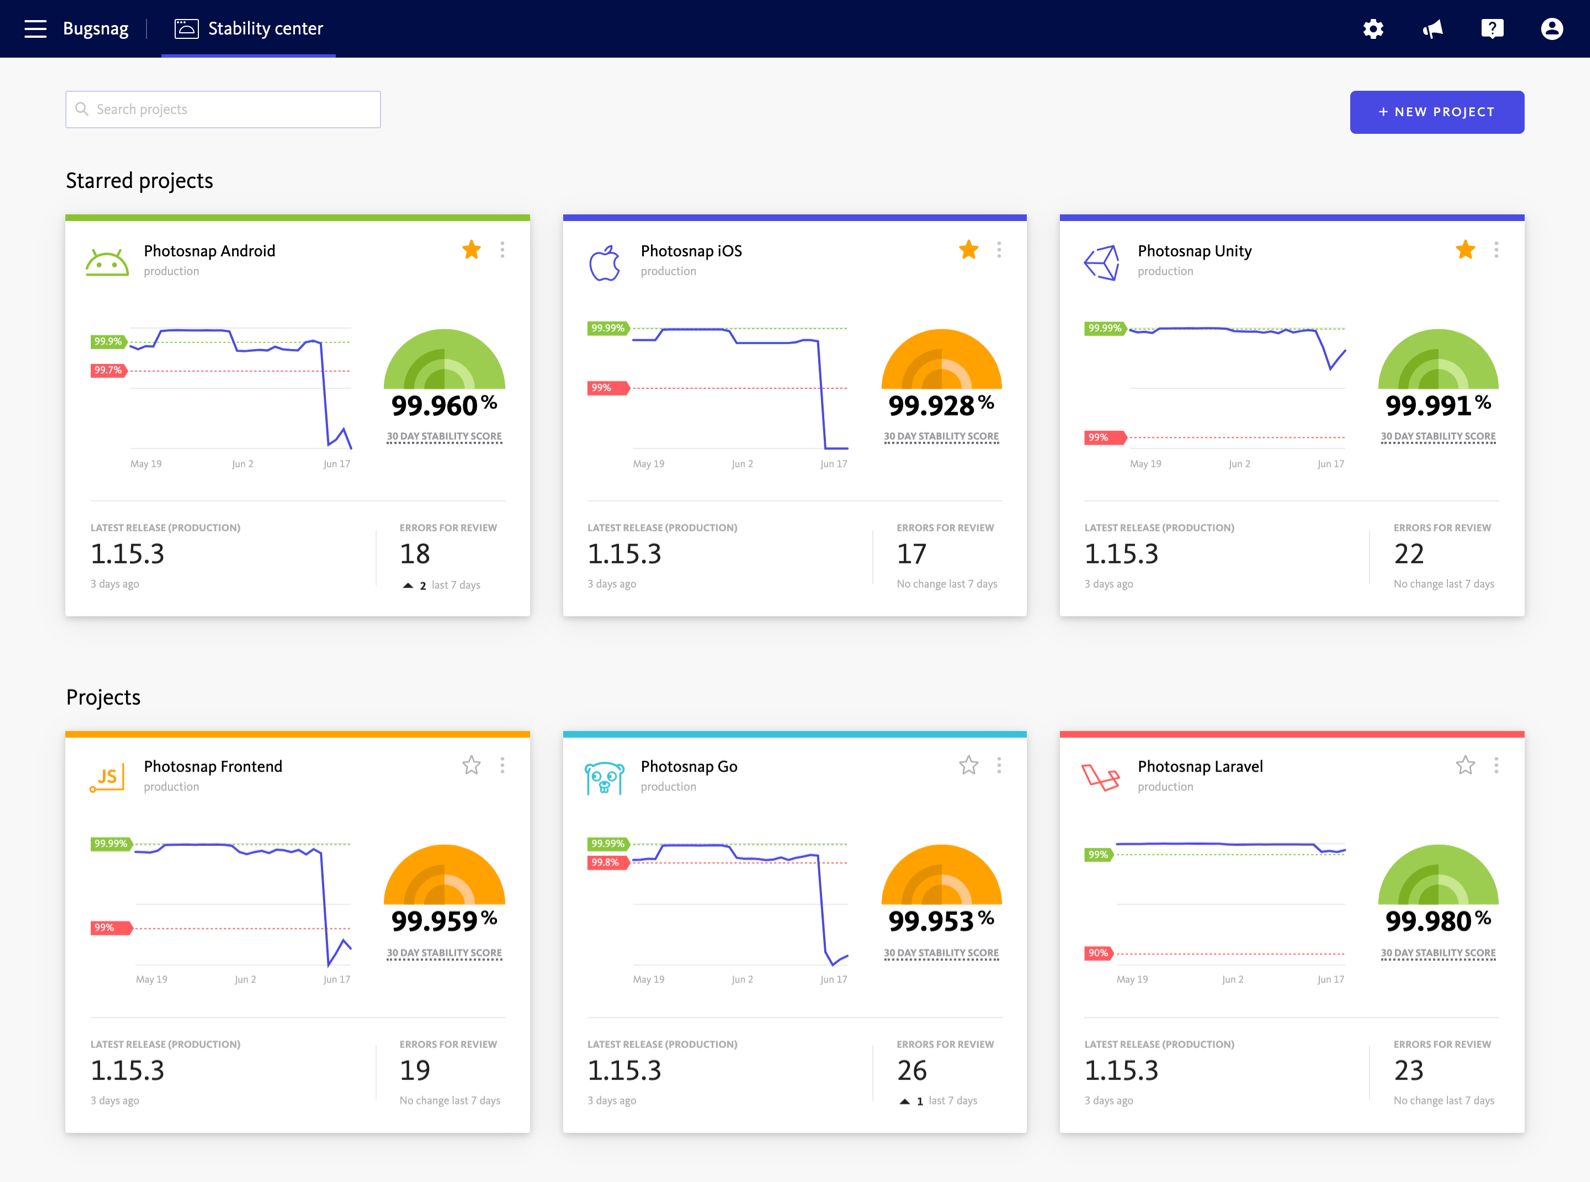
Star applications that are important to you ⭐
Personalize your Stability Center by star-ing applications that are more important to you so they appear at the top for a quicker view. These can be applications which you are managing or contributing to, those which are business critical, or generating revenue.
For example, if you’re an executive or engineering leader at a mobile gaming studio, you may want to star the most downloaded games or the newly released game.
Monitor the team’s progress towards achieving stability targets
You can set two stability targets in Bugsnag — target stability and critical stability.
- Critical stability is your SLA (Service Level Agreement) or the point where your whole team agrees that the product is on fire and needs attention immediately.
- Target stability is your SLO (Service Level Objective) or aspirational stability goal that many organizations communicate externally to set appropriate user expectations.
You can monitor each application’s stability against these two in the Stability Center, which helps you understand how your teams are progressing towards achieving the target stability and upkeeping your SLO.
Understand trends in stability and application health
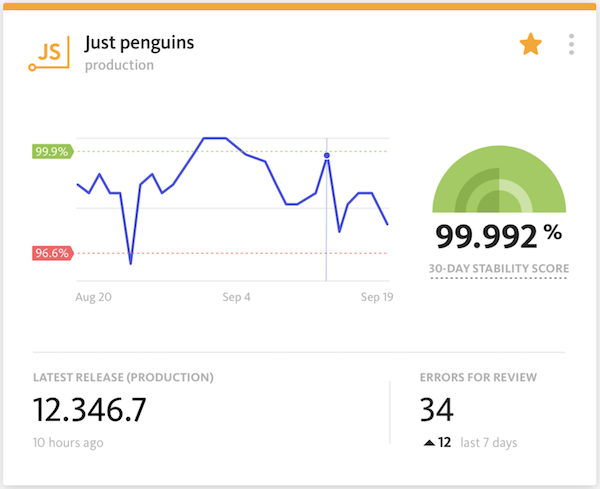
Within each card in the Stability Center, you can see the application’s 30 day stability score and a graph of how it has changed over the past 30 days, which allows you to see trends in stability and application health over time.
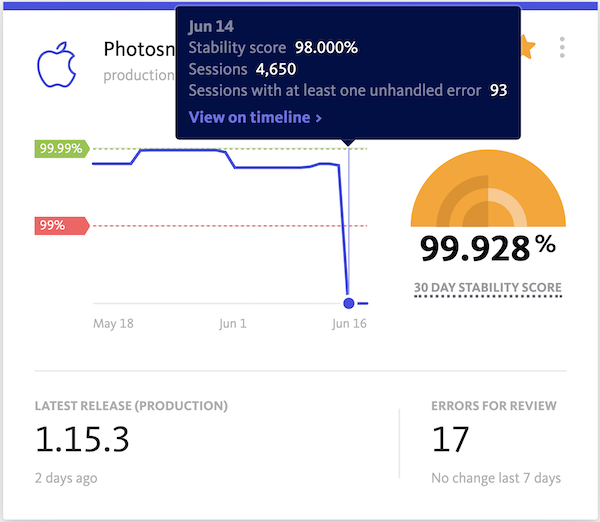
Using the graph, you can understand when application stability was above the target stability, between the target and critical stability, or below the critical stability over the past month. Hover over the graph to see a tooltip for each day, with the stability score, session count, and session count with at least one unhandled error. You can also click through to view on the timeline all the errors that impacted the stability score that day.
You can investigate each of these ebbs and flows to see what was happening, whether they were caused by a new unstable release, a backend service interruption, or a spike in errors. When these issues are resolved, you should see an upward trend in stability, so the graph can also be used to monitor how effective the team’s debugging activities are.
Make data-driven decisions about which applications need to be prioritized for debugging
The stability scores and the corresponding green, yellow, and red indicators, along with the errors for review count let you know which applications should be prioritized for debugging. You can use this to decide where engineers should spend their time, whether on fixing bugs to improve application stability and customer experience, or on new feature development.
For example, if the stability score is below your critical stability (red), then engineers should definitely prioritize bug fixing but when the stability score is above your target stability (green), then engineers can continue with new feature development.
We’re excited for you to use the new Stability Center to gain executive insights into application stability and health, see how your team’s progressing towards achieving stability targets, and make data-driven decisions about which applications need to be prioritized for debugging and how engineers should spend their time.
Getting started
Current customers and trial users can view their Stability Center by logging in to their accounts. Be sure to star projects that are important to you and check to confirm that your stability targets are set correctly and that you have selected the primary release stage. Please don’t hesitate to contact Support if you have any questions or feedback.
Since the Stability Center shows a card for every project, you may see some cards for projects that are not in use and can be cleaned up. If some cards appear to be missing information, it may be because your organization is on Bugsnag’s Lite plan and stability scores and targets, which provide richer data such as the 30 day stability score and trend graph, are only available on the Standard and Enterprise plans. You can learn more about Bugsnag’s plans here.
If you’re new to Bugsnag, contact us for more information and a customized demo for your team!