Definitive metric for balancing bugs and features
Make data-driven decisions about team priorities
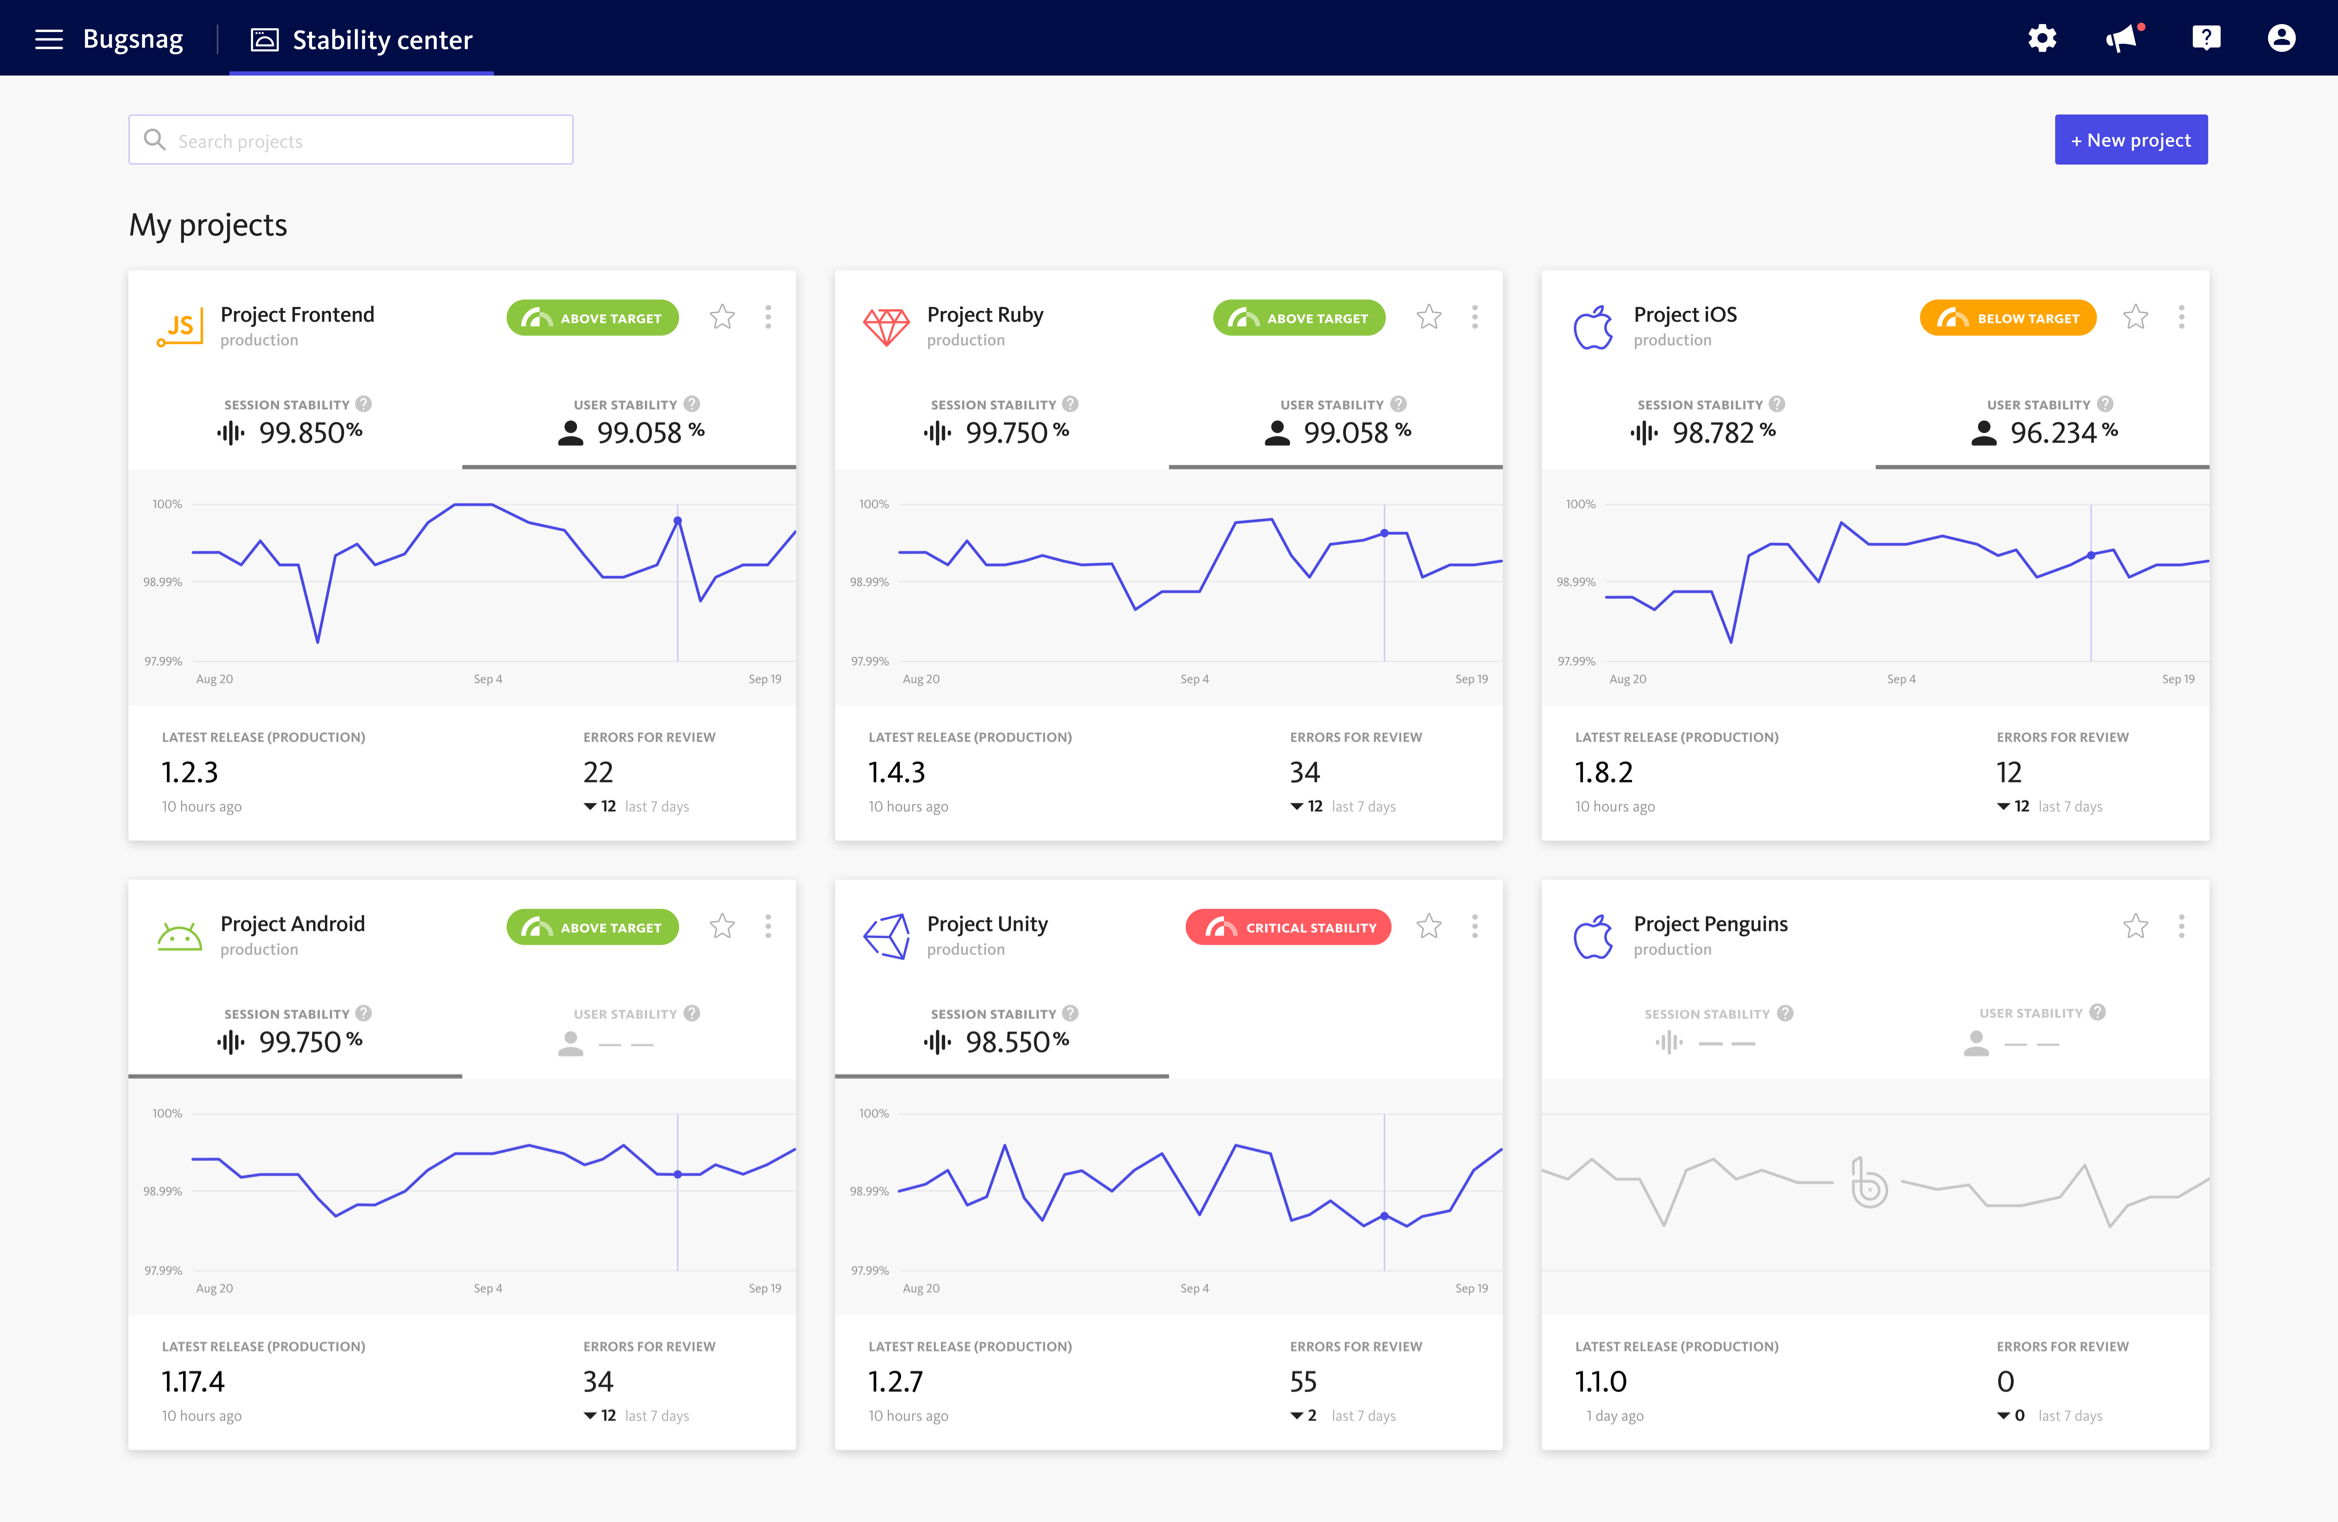
Gain insights into the stability of all applications in the Stability Center
See 30 day stability scores and trends graphs based on users or sessions for each application to
understand how the stability has changed over time and if the team is trending towards achieving
stability targets.
Make data-driven decisions about which applications the engineers
should prioritize for debugging to improve stability and customer experience.
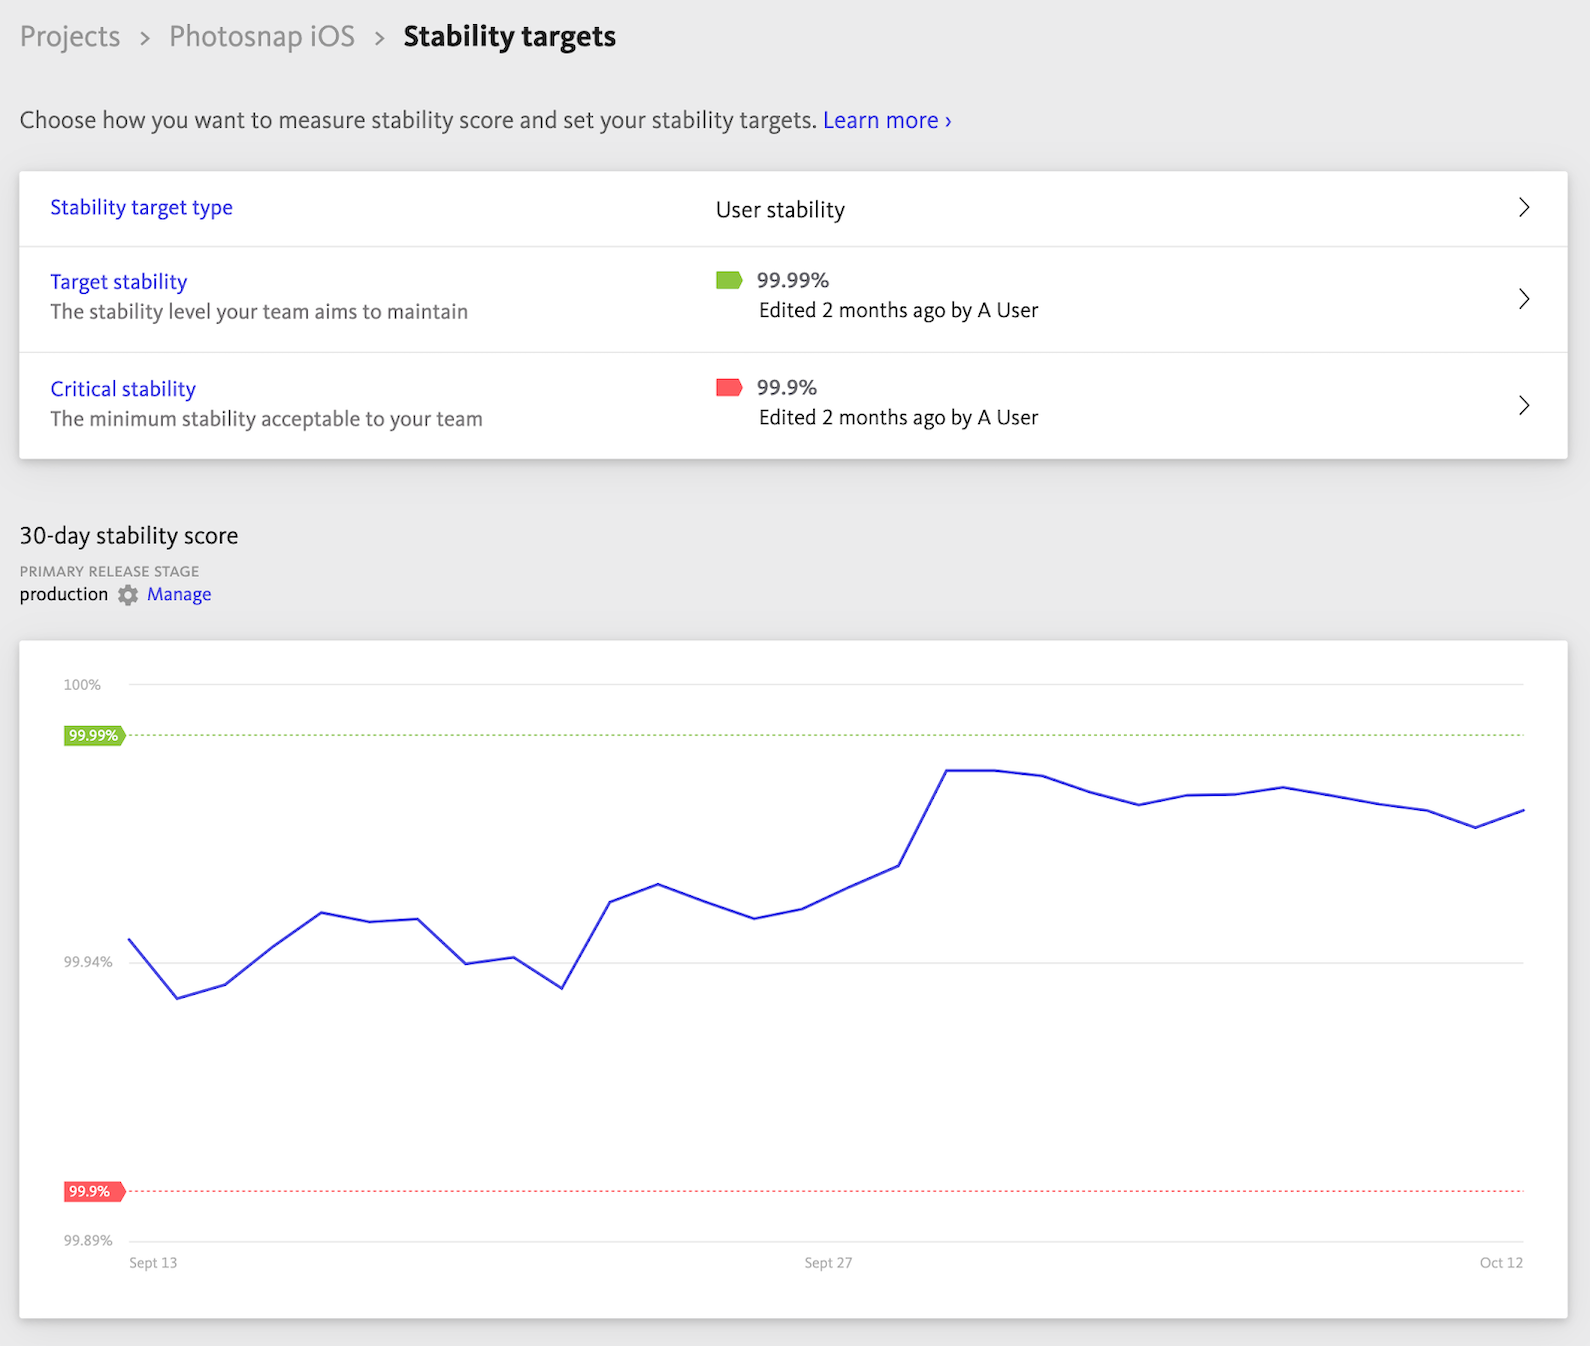
Set targets for stability
Set critical stability and target stability to use the stability scores and indicators to balance
the need to fix bugs with the drive to build new features. Choose which type of stability you
want to use when setting targets — user-based or session-based.
When the stability score
dips below critical stability, work on debugging errors to improve stability. If stability meets
or exceeds your target, get back to building new features for your users. From Dev to Ops, this
objective metric aligns the team and ensures everyone knows how stable your application is in
production.
Track stability across releases
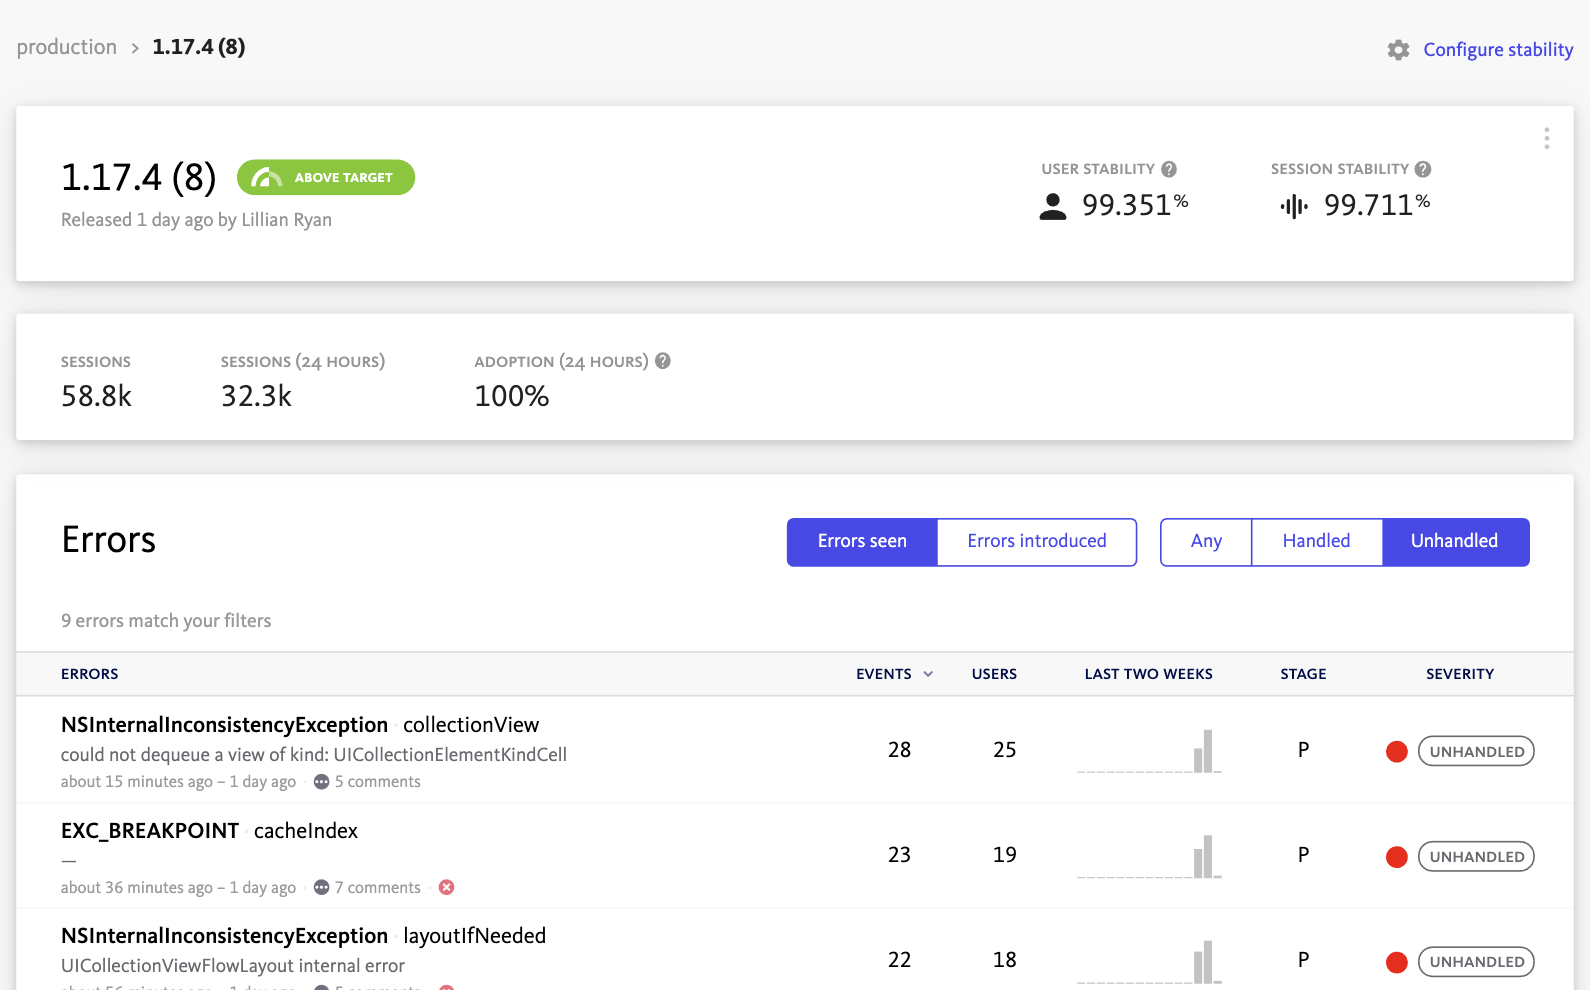
Focus on building features when you exceed your stability target
The stability score is dynamically colored to help you make a quick assessment of your application's health after a release.
When the stability score is green, the release meets or exceeds the average stability of the application. Nice work!
Intervene when stability drops
When the stability of a release is below average, the stability score will be red to let you know to investigate further.
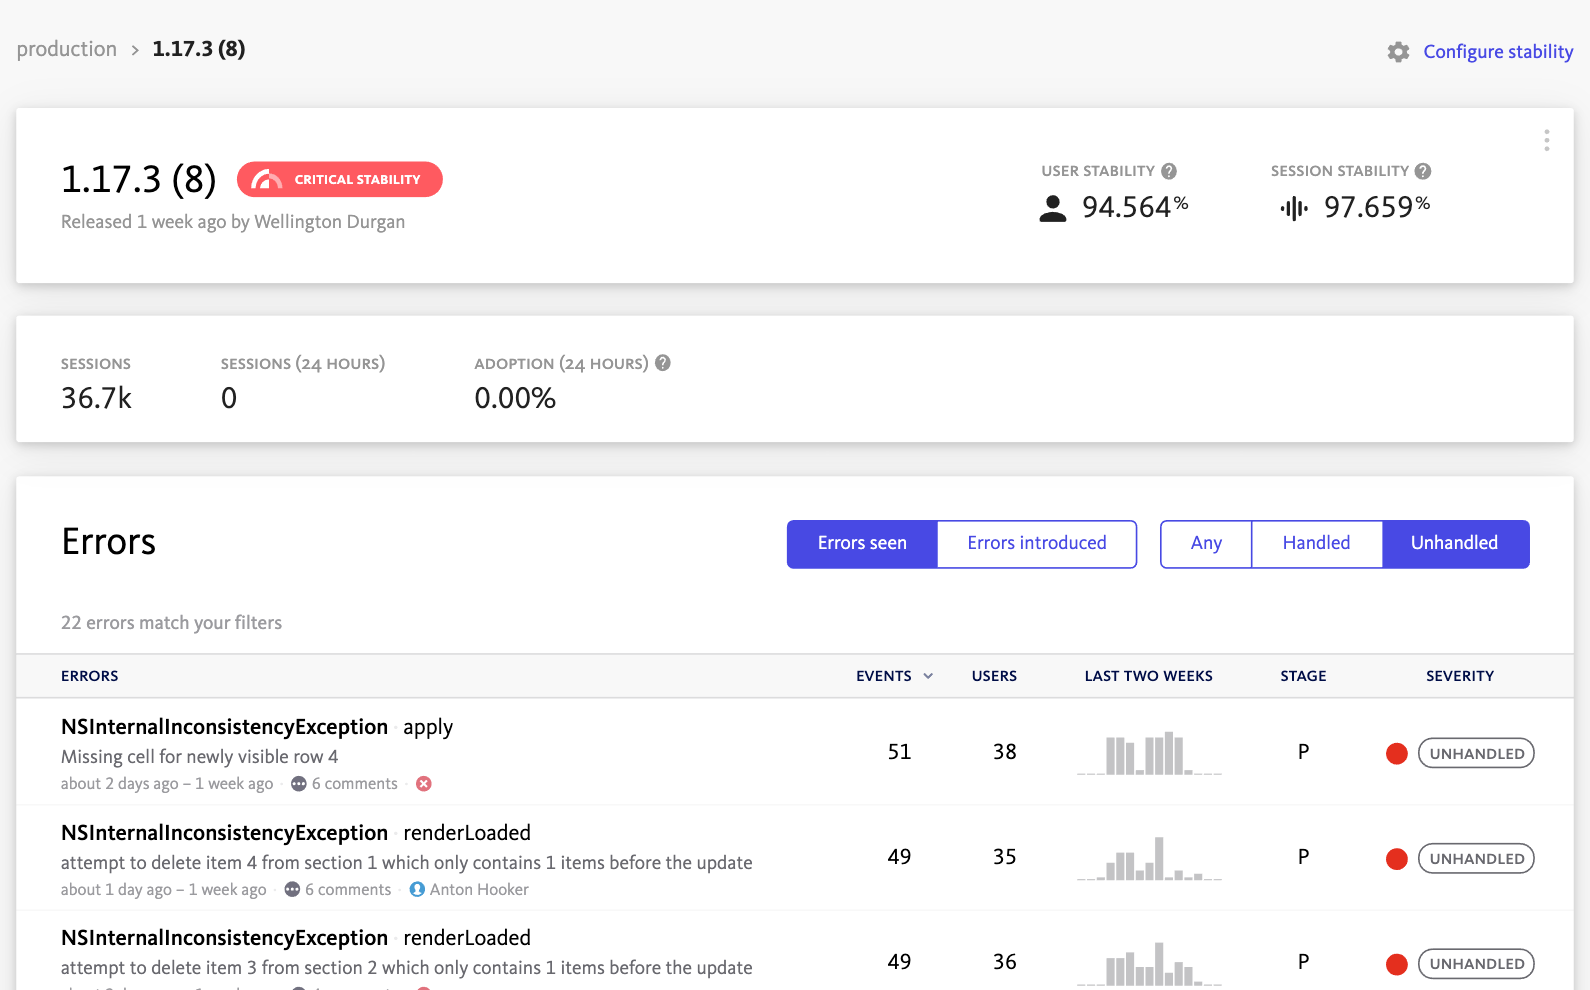
Resolve the root cause of stability issues
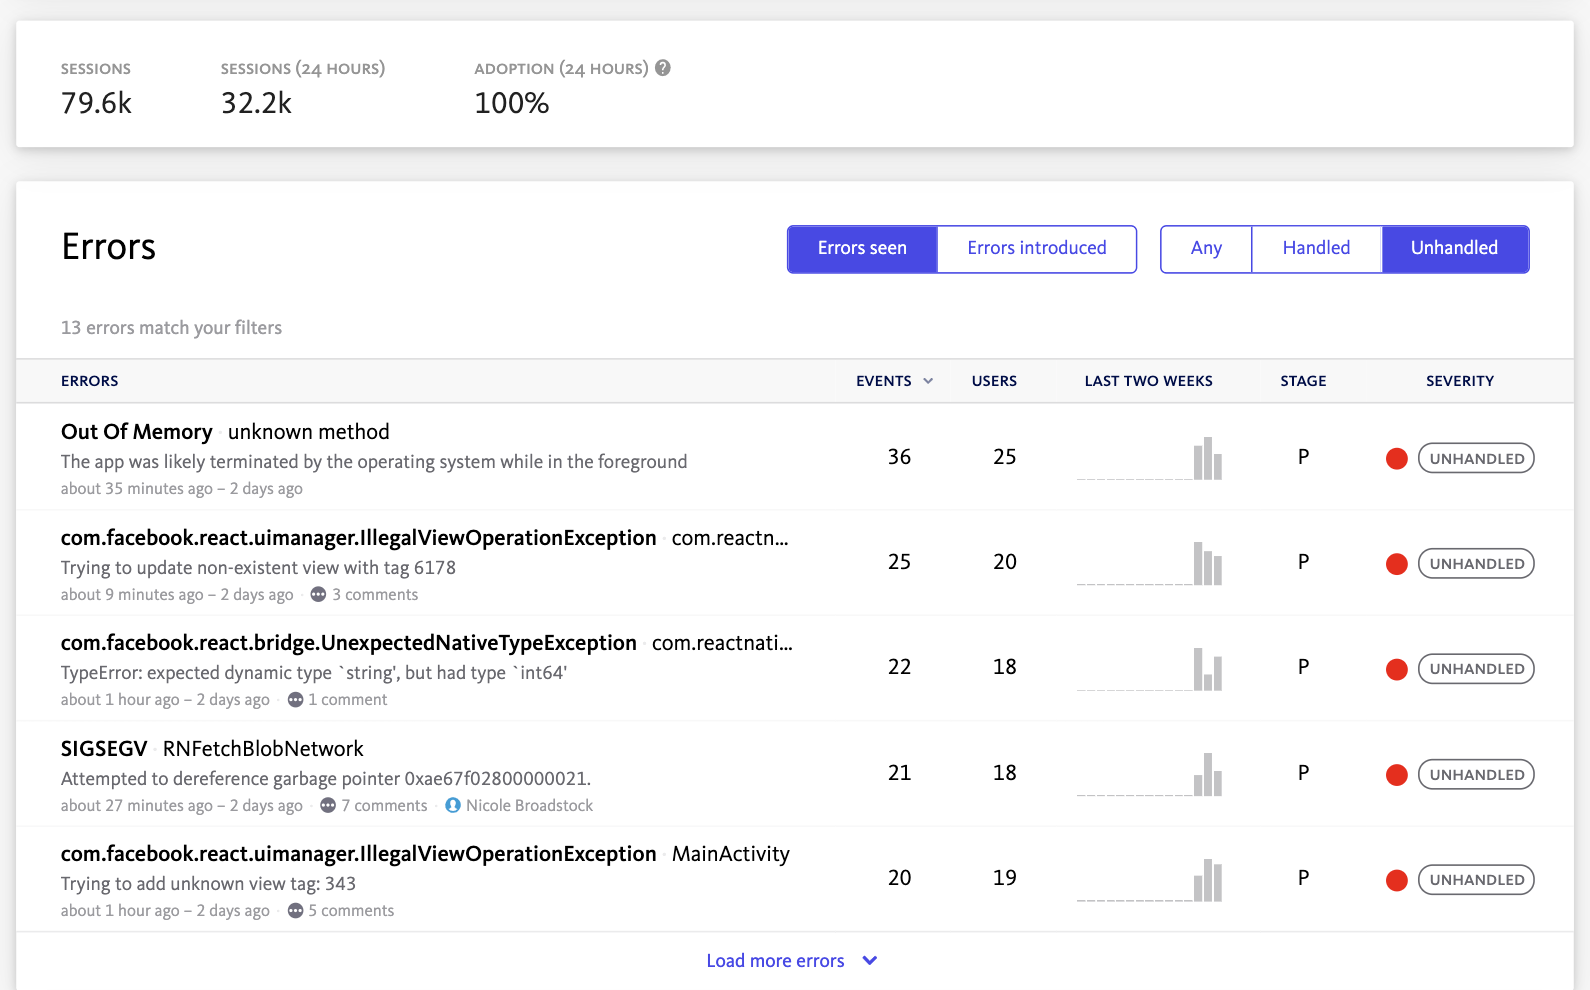
Automatic bug prioritization
When stability drops, BugSnag lets you see the top 5 errors occurring in that specific release so you know where to spend your time investigating.


