
How to Track Common JavaScript Errors & Handle Exceptions
JavaScript errors are common, even on the world’s largest websites. With so many errors, it’s hard to know what you can safely ignore and where you should spend your bug-squashing efforts.
Fortunately, developer tools and best practices can help you capture every error and prioritize them, so you can handle the exceptions that matter and focus on building features when they don’t.
Let’s look at the various types of JavaScript errors, how to identify and track them, and strategies for handling exceptions.
JavaScript errors are notoriously commonplace but challenging to debug, making error monitoring a must-have in today’s world.
Different Types of JavaScript Errors
JavaScript errors come in many different flavors. Before diving into how to track errors and handle exceptions, it’s helpful to understand the most common types you might come across.
The three most common types of errors include:
- Syntax errors occur during interpretation time due to a spelling mistake or other error related to JavaScript syntax.
- Runtime errors occur during execution time when you call a method that doesn’t exist or make a similar mistake.
- Logical errors occur when the syntax and runtime work properly, but you get an unexpected result after execution.
These error types come in six different forms:
- RangeErrors occur when a number is outside of an allowable range. E.g., Trying to create an array that’s too large.
- ReferenceErrors occur when referencing a non-existent variable or method. E.g., Calling toUperCase() rather than toUpperCase().
- SyntaxErrors occur when you type invalid JavaScript code. E.g., Forgetting to close a parenthesis.
- TypeErrors occur when there’s a mismatch between inputs and outputs. E.g., Trying to call toUpperCase() on a number.
- URIErrors occur when you call a URI handling function with the wrong parameters.
- InternalErrors occur when there’s a problem with the JavaScript engine. E.g., Too many recursive calls.
These six error types are actually constructor functions that throw error objects. Fortunately, you can catch these errors and fix them before they cause issues with a little error-handling code. In addition to showing users a helpful message, you can log the error for future diagnosis.
A try/catch/finally block is the most common way to handle synchronous errors. On the other hand, if you have asynchronous JavaScript code, you’ll typically use a callback pattern (promises) and event emitters to “listen” for any errors that may occur and handle them at that time.
How to Identify, Track & Prioritize Errors
Many developers troubleshoot JavaScript errors in Chrome DevTools or similar tools. But these tools aren’t beneficial when organizing and understanding errors. And you’ll only catch errors in your browser session.
A better approach involves detecting errors across sessions using an error monitoring tool. That way, you can aggregate the data to discover the most common errors across different devices, operating systems, and browsers rather than relying on a single developer machine.
BugSnag provides an all-in-one error monitoring solution that automatically detects JavaScript errors, generates detailed diagnostic reports, prioritizes them based on severity, and notifies your team through team messaging apps like Slack or issue trackers like JIRA.
You can install BugSnag with a single script tag or via NPM. And without the need to change code or add try/catch blocks, you can immediately begin identifying every JavaScript error thrown in your application.
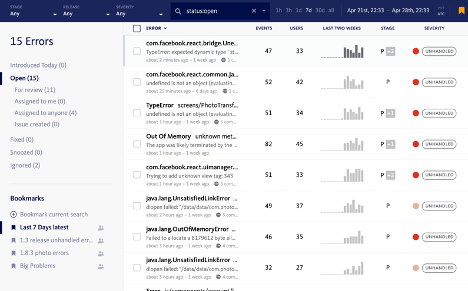
BugSnag’s most powerful feature is the Stability Score, which shows you the percentage of sessions in a release that end in a crash. With this KPI in place, you can quickly determine when to focus efforts on troubleshooting bugs versus developing new features.
Of course, there are also several best practices to remember regardless of the error monitoring solution you choose. For instance, you should always use source maps to map minified code to actual lines of code and assign version numbers to ensure you’re tracking the right problems.
Efficiently Handling Exceptions
JavaScript errors are notoriously difficult to track down. While error messages might tell you the line of code throwing an error, the root cause of the error is typically further down the rabbit hole.
The most common way to debug a JavaScript error is using a stack trace – or a list of method calls a program makes when an error or exception occurs. You can use the data to navigate through the code base and determine the exact piece of code causing the problem.
BugSnag goes beyond stack traces to provide unparalleled visibility into JavaScript errors. For instance, the platform supports JS frameworks, like React, Vue, and Angular, with error-reporting libraries that hook into the frameworks’ error handler and report framework-specific diagnostics. As a result, you can get to the root cause faster.
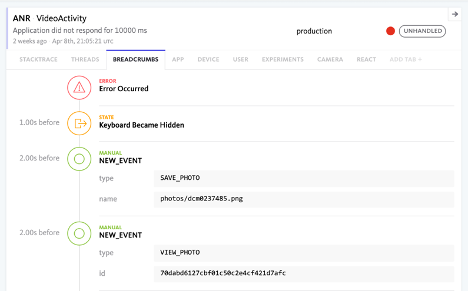
BugSnag’s breadcrumbs also make it easy to access a timeline of user actions and system broadcasts leading up to an error, making it easy to reproduce the error with minimal effort.
And finally, BugSnag’s search and segmentation capabilities enable larger development teams to route errors to the correct people for follow-up. For example, you can filter errors by release (e.g., latest) and context (e.g., a shopping cart). Or, you can segment errors based on VIP users or other factors to prioritize those that matter most.
The Bottom Line
JavaScript errors are common in most web and mobile applications. Rather than trying to solve every issue, development teams should focus on quickly identifying errors, prioritizing them to focus on what matters, and efficiently fixing them with the help of full-stack diagnostic tools to minimize the impact on user experience.
BugSnag makes it easy to accomplish these goals using a single platform. With just a few lines of JavaScript, you can instantly see the errors affecting your application and its users. Then, you can quickly prioritize those errors, route them to the right people, and fix them using cutting-edge diagnostic tools.