
Symbolicating iOS crash reports and logs
When faced with an iOS crash report from your app, it can be difficult to identify where in the code the error actually occurred.
Thread 0 name:  Dispatch queue: com.apple.main-thread
Thread 0 Crashed:
0   bugsnag-example   0x0000000100099cb4 0x100094000 + 23732
1   bugsnag-example   0x000000010009b250 0x100094000 + 29264
2   bugsnag-example   0x0000000100099328 0x100094000 + 21288
3   bugsnag-example   0x0000000100099380 0x100094000 + 21376
4   UIKit             0x0000000192d1b7b0 -[UIApplication sendAction:to:from:forEvent:] + 96
5   UIKit             0x0000000192d1b730 -[UIControl sendAction:to:forEvent:] + 80
6   UIKit             0x0000000192d05be4 -[UIControl _sendActionsForEvents:withEvent:] + 452
7   UIKit             0x0000000192d1b01c -[UIControl touchesEnded:withEvent:] + 584
8   UIKit             0x0000000192d1ab44 -[UIWindow _sendTouchesForEvent:] + 2484
9   UIKit             0x0000000192d15d8c -[UIWindow sendEvent:] + 2988
10  UIKit             0x0000000192ce6858 -[UIApplication sendEvent:] + 340
11  UIKit             0x00000001934d3cb8 __dispatchPreprocessedEventFromEventQueue + 2736
12  UIKit             0x00000001934cd720 __handleEventQueue + 784
13  CoreFoundation    0x000000018ce51bc0 __CFRunLoopDoSources0 + 524
14  CoreFoundation    0x000000018ce4f7c0 __CFRunLoopRun + 804
15  CoreFoundation    0x000000018cd7e048 CFRunLoopRunSpecific + 444
16  GraphicsServices  0x000000018e801198 GSEventRunModal + 180
17  UIKit             0x0000000192d51628 -[UIApplication _run] + 684
18  UIKit             0x0000000192d4c360 UIApplicationMain + 208
19  bugsnag-example   0x000000010009ac78 0x100094000 + 27768
20  libdyld.dylib     0x000000018bd605b8 start + 4
The generated iOS crash report often shows the memory address relating to each stacktrace frame rather than the source location. This makes it difficult to identify where in the code the error occurred, making it harder to identify what caused the bug.
The crash report doesn’t contain the source information because, by default, the debug symbols are stripped when compiling a release build to reduce the size of the generated binary. Those debug symbols carry the required information to translate from a memory address to the associated source file and line number.
Fortunately the stripped debug symbols are stored in an accompanying dSYM file. The application binary and dSYM file are tied together on a per-build-basis by the build UUID. Xcode provides a number of tools to apply the debug symbols from a dSYM file to a stacktrace — this is called symbolication. Symbolication of crash reports makes it easier to identify the origin of errors, making it easier to identify and resolve bugs in a timely manner.
Better Swift stacktraces
I recently looked into why some iOS stacktraces built with Swift occasionally have no line number information available after symbolication, making it harder to understand where in the stacktrace the error occurred. To understand why this happens and see if there’s a solution for it, I looked at the different tools available for symbolicating an iOS crash report to see if any of them were able to provide the missing information.
What is needed for iOS symbolication?
In order to symbolicate a crash report you need:
1. The dSYM file for the app binary
2. The symbol address of each frame in the stacktrace
Finding the dSYM
If you have Bitcode enabled in your application’s project settings, the dSYM files will be generated by Apple when you submit a build. You can download them by opening the Xcode Organizer, selecting your app, then using “Download dSYMs…”.
If you’re not using Bitcode, you can find the dSYM files on the machine used to build the app. First you should check that the dSYM gets generated during building — this is controlled via the Debug Information Format build setting in Xcode.

The location of the generated dSYM varies depending on how the app is built:
- For scheme based builds, it’s configured by the
Derived Datasetting in theLocationssection of the Xcode preferences. Within the Derived Data directory, the path to the dSYM varies depending on the build configuration and platform — it’ll have a suffix of.dSYM. - If you’ve archived the app, you can explore the package contents of the
xcarchivefile and will find the dSYMs in there. - If you know the UUID of your app, you can find the dSYM with
mdfindcommand (mdfind <uuid_of_app>).
Once you know the location of the dSYM, you’ll find the dSYM file itself inside a Contents/Resources/DWARF subdirectory.
Calculating the symbol address of a stackframe
The symbol address can be calculated as follows:
symbol address = stack address - load address + slide
where:
stack addressis the hex value of the stacktrace frame from the crash reportload addressis the first address shown in the Binary Images section of the crash reportslideis the value ofvmaddrin the dSYM. This can be found by usingotoolon the dSYM and looking for thevmaddrsection:
otool -arch <arch> -l <path_to_dsym> | grep __TEXT -m 2 -A 1 | grep vmaddrTools available for crash report symbolication
Once you have the dSYM file and symbol address, you can use a number of different tools to lookup the original file and line number for the stacktrace frame. Each tool works differently but can provide you with the desired information to symbolicate stacktrace frames.
dwarfdump
dwarfdump is an Xcode tool that prints debug information from a dSYM file. It can also be used to lookup the debug line information for a particular address.
dwarfdump --arch=<arch> --lookup=<symbol_address> <path_to_dsym>atos
atos is a symbolication tool from Apple. It converts numeric addresses to their symbolic equivalents. atos calculates the symbol address for you if you supply the load address and stack address, so you don’t need to calculate the symbol address yourself.
atos -arch <arch> -o <path_to_dsym> -l <load_address> <stack_address_in_crash_report>
symbolicatecrash
symbolicatecrash is a tool that’s available with Xcode. If you have access to the .crash file, you can run symbolicatecrash against the file with the dSYM and it will output the symbolicated crash report.
The location of symbolicatecrash varies depending on the version of Xcode. You’ll need to find the location and add the path to your PATH environment variable.
To use it on the whole crash report:
- Set the DEVELOPER_DIR environment variable to your Xcode installation path. e.g.
export DEVELOPER_DIR=/Applications/Xcode.app/Contents/Developer
- Run the tool
symbolicatecrash -d <path_to_dsym> -o <path_for_symbolicated_crash> <path_to_crash_report>lldb
lldb is the debugger that comes with Xcode and is used for debugging your applications. However, it can also be used manually on the command line to look up debug information from a dSYM.
lldb
target create --no-dependents --arch <arch> <path_to_dsym>
image lookup --address <symbol_address>
What causes the missing line numbers in Swift?
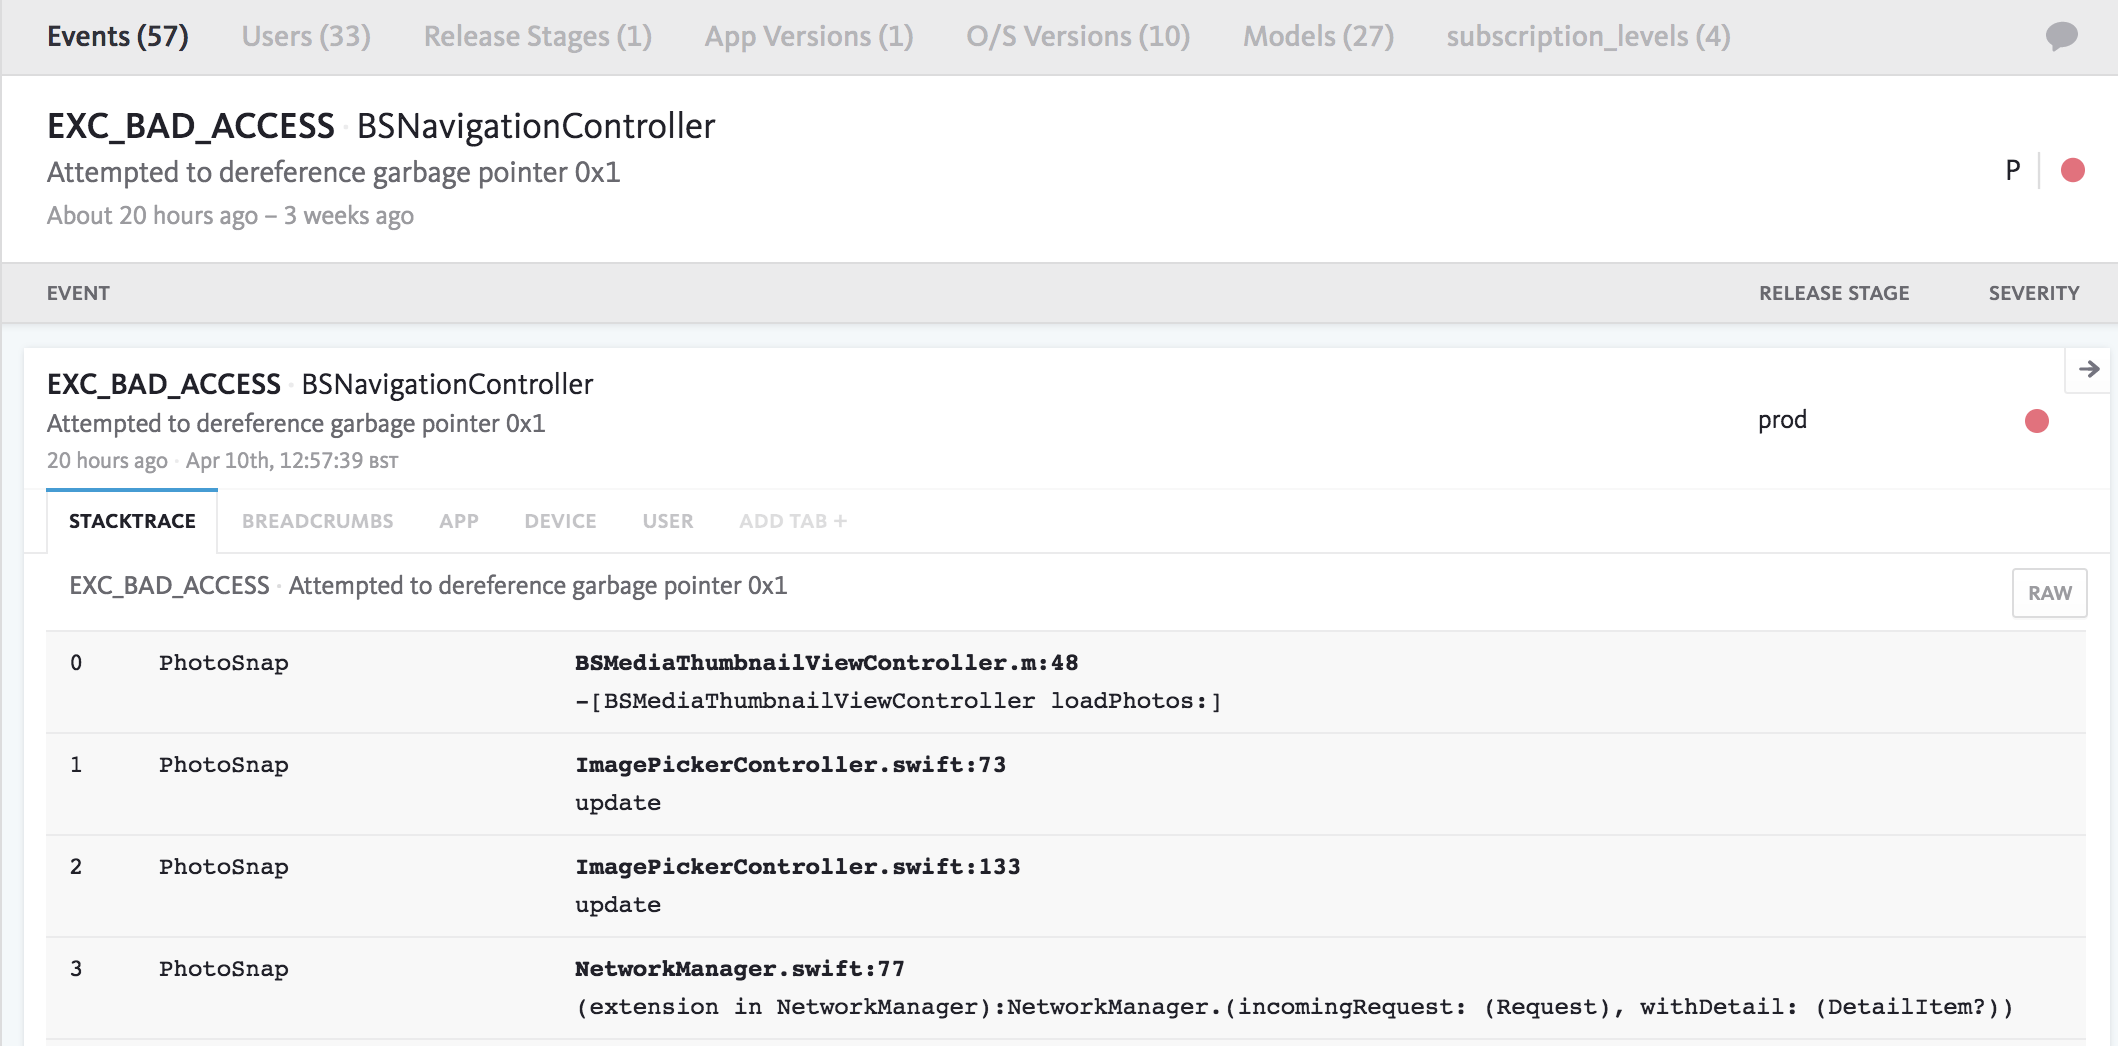
I tried these different tools on a sample Swift stacktrace, with missing line number information after symbolication, to see if any of them could give me the line number. I came to the conclusion the required information wasn’t available in the dSYM for those frames. After playing about with generating different Swift stacktraces that had this problem, I found there were two apparent causes for this:
- Optimization is enabled for the Swift compiler causing simple functions (or closures) to get optimized away
- Auto generated code (such as code bridging between Objective-C and Swift) cause frames to appear in the stacktrace without relating to actual lines of code
The Swift optimization level can be changed to reduce the chance of the missing line numbers, but this has an effect on the size and performance of the generated app binary.
You can configure the Optimization Leveloption in the Xcode Build Settings under the Swift Compiler - Code Generation section.
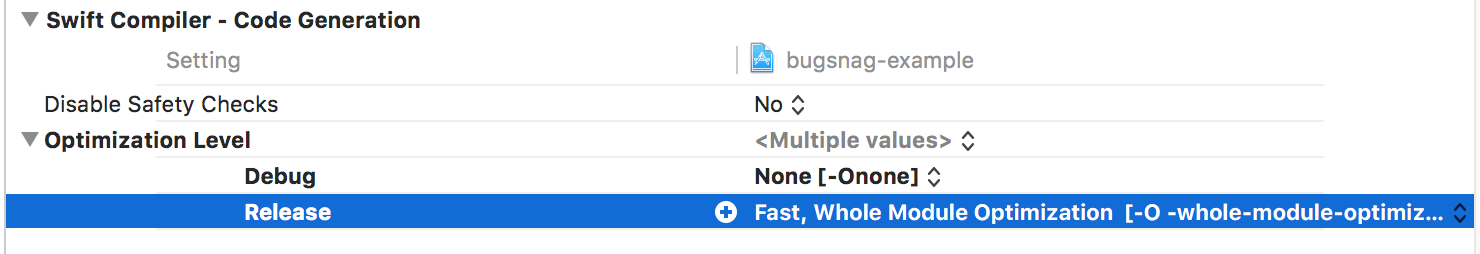
From experimentation when using an optimization level of None, line numbers were mostly returned for each frame. However, there were still some frames with no line number — these normally manifest as two consecutive frames that have the same file and method — one with a line number and one without. This is likely due to Swift having some internal code to bridge between a call to Swift code from Objective-C.
Setting the optimization level to Single-File solved the optimized zero lines number when calls were being made between files (as only functions within the same file are being optimized), but some frames for function calls in the same file still had line number zero.
Setting the optimization level to Whole Module resulted in a greater chance of getting zero line frames (as it optimizes all function calls).
Trade off between optimization and debug information
Even with a number of tools being available for symbolicating a crash report it’s not always easy to trace back every line in a crash to its original source location. It ends up being a trade off between optimizing the app for size and performance and being able to obtain useful information from any errors that occur in order to identify and address bugs more easily.
Symbolicating iOS crash reports with Bugsnag
At Bugsnag we symbolicate all iOS crash reports that we receive if you upload the dSYM file to us.
You can easily integrate Bugsnag into your iOS app to automatically capture and report crashes. We also support capturing and symbolicating native iOS errors that occur in React Native apps.
———
Learn more about iOS crash reporting with Bugsnag, and see our open source library on GitHub.
Mike is a senior software engineer at Bugsnag. Bugsnag automatically monitors your applications for harmful errors and alerts you to them, giving you visibility into the stability of your software. Take a proactive approach to code quality and fix errors impacting your users.